

You have 5 instances running. How do you know which one is killing your CPU?
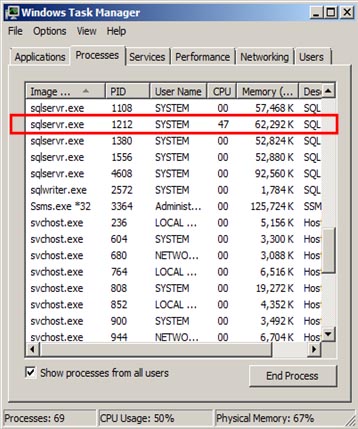
As you can see from Windows Task Manager, you have several instances of SQL installed and one of them is using nearly half of the CPU. To figure this out, you'll need to know the PID (Process ID) number.
To view the PID number in Windows Task Manager, from the menu select View, then Select Columns, and then check the box for PID. For our example, it's Process ID 1212 that's using nearly 50% of our CPU.
To view the PID number in Windows Task Manager, from the menu select View, then Select Columns, and then check the box for PID. For our example, it's Process ID 1212 that's using nearly 50% of our CPU.
So how do you correlate that PID to the SQL instance, so you can start the performance investigation? There's a couple of places you can find this information.
The first place is to look at the most recent SQL Error Log for each of your instances. One of the very first entries will be the PID value.
Server process ID is 1212.
The other place is to open the SQL Server Configuration Manager, select SQL Server Services from the left hand side, then right click on an instance and click Properties. Click the Service tab and you'll see the PID value for that instance.
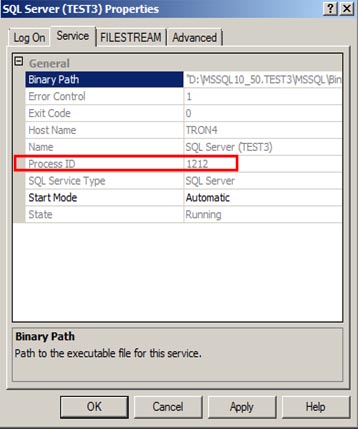
Both of these methods give show you which instance is our culprit. Now you can drill into that instance to find out why it's killing your CPU.
I prefer to look for this value in the SQL Error Log because I already have Management Studio open ready to investigate the issue. Keep in mind the PID value will change every time your SQL instance is started.
