In the previous post (http://www.sqlservercentral.com/blogs/denniss-sql-blog-1/2016/09/30/say-hello-to-sql-live-health-check-part-1/) I talk about the main screen where you can have a single glance of the healthiness of all your db instances, clear color-coded for issues occurring at the time. You might ask, whats about trends, how can I change threshold..... This post is all about that!
Let's get to the trend first, to get the server detail screen up, all you have to do is click on the server name, the below screen will come up: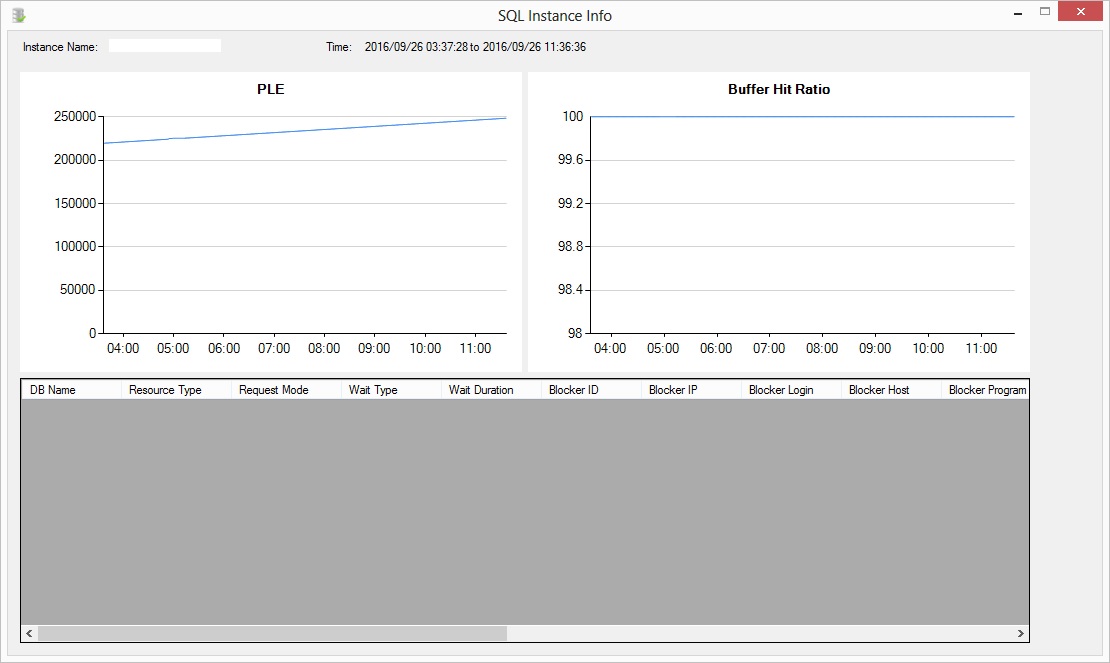
Here is what you can see trends for the given instance, by default, it shows the last 8 hours of data (it can be configured). The screen divided into 3 parts - PLE, buffer hit ratio and blocking info. both PLE and buffer hit ratio is pretty self explanatory, the y-axis for PLE is in ms as what you will get when you perform the query manually, I might change that to a more "human readable" format in the next version. Buffer hit ratio is surely in percentage for y-axis.
The bottom part is the blocking info, and it has lots of information there, here is the list of it:
| DB Name | The db name where the blocking occurs |
| Resource Type | Blocking resource type |
| Request Mode | Query request mode |
| Wait Type | Wait type for that blocking |
| Wait Duration | Total duration of the block in ms |
| Blocker ID | The SPID for the blocker |
| Blocker IP | IP address for the host which execute that query |
| Blocker Login | Login name for the blocker query |
| Blocker Host | Host name for the blocker query |
| Blocker Program Name | Program name for the blocker query |
| Blocker Last Batch | Last batch time for that blocker query |
| Blocker Text | The SQL statement for that blocker query |
| Request ID | SPID for the requester |
| Request IP | The IP address for the host which execute the query |
| Request Login | Login name for the requester query |
| Request Host | Host name for the requester query |
| Request Program Name | Program name for the requester query |
| Request Last Batch | Last batch time for that requester query |
| Request Text | The SQL statement for that requester query |
This should gives you a pretty good idea of the blocking info along with which query is being blocked and by whom. As you can see, its very simple to use and show you the key information of your db instance. Let's move on to the configuration:
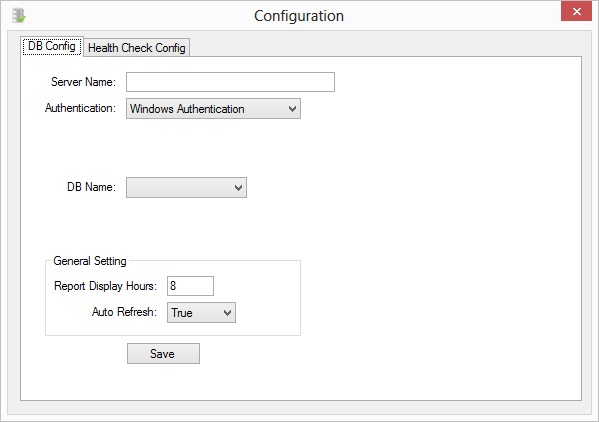
Under the file menu, click on config to bring up the screen (if will automatically show up at first use). Here you will need to configure the db instance where it keep the data, by simply entering the server name and the login method along with the DB name you want it to use, it will automatically checks if the necessary tables exists, if not, it will prompt to create that for you.
In the general setting panel, you can configure the display hours for report, which controls how much data will be displayed in the server view (shown as above), also if you want to enable auto refresh. Auto refresh interval currently cannot be change, and is running every minute. In the next version, I will allow the change of the interval so that one can set the frequency of the data collection.
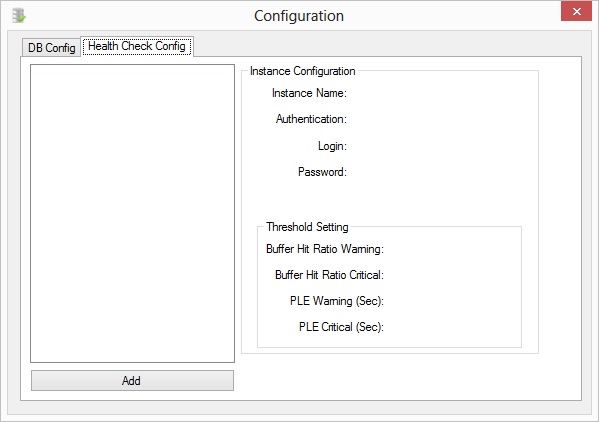
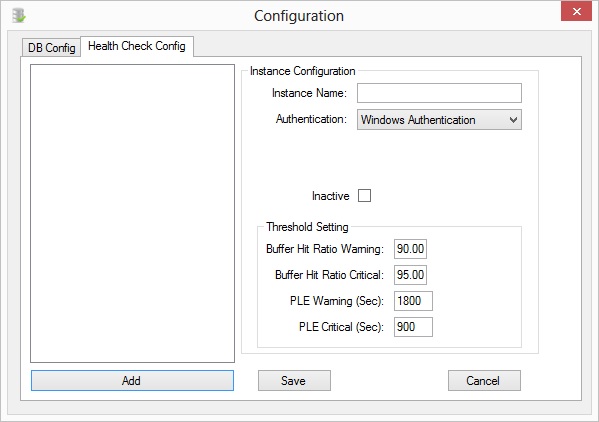
Once you got the server setup ready, you can click on the save button and move on to the health check config tab.