In this article we will look at one spectacular case of sudden exploded CPU utilization and a very simple solution in fixing the issue. Imagine a SQL Server instance sitting on a box with 32 CPUs and all of them running with 100% utilization. It is hard to believe that an average size application in production can make all of the CPUs totally busy, but that was the case. My “sudden exploded” wording sounds like a tautology because it is never really expected. It probably sounds like that notorious explanation so often given by drivers involved on auto-collisions: “that car came out-of-nowhere”. Unlike the drivers we are fortunate to have a very simple fix, though as you are going to see later it took quite a while to figure it out.
It all started when an online reindexing was implemented for one of our applications in production. An online reindexing is a perfect solution for 24x7 applications. It causes no interruption for the application activities.
One of our clients is a retail company running on SQL Server 2008 for a number of years. It recently changed its requirements: its users must be able to access the service 24x7 with no interruption even for maintenance on early Sunday morning. As a DBA I implemented online reindexing. The maintenance was running from a SQL Server job, executing a script looping through the list of databases marked in the application maintenance plan and reindexing the application database tables/indexes one-by-one.
The script was successfully used in other applications before and it was tested with this application in QA for several weeks and worked perfectly. The first two weeks in production were also hassle-free. The external clients of the application were hitting the database all the time while the database was reindexed. There were still occasional blocks recorded, but the blocks were short. Nothing close to what was seen when running the offline reindexing.
Reindexing causes 100% of CPU utilization.
However the next run of weekly maintenance brought a bizarre issue. The CPU utilization increased to 100% in the middle of the reindexing. The rebuild index was running on early Sunday morning and when an alert was sent off, I was called.
I found that the CPU utilization on the box was hitting the roof after a pretty sharp increase that started 25 minutes ago.
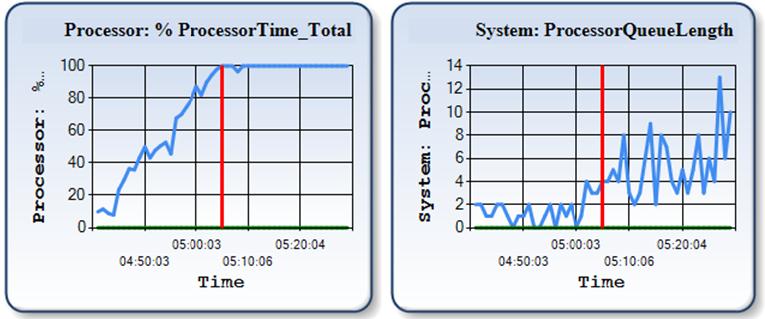
Figure 1. CPU utilization and Processor Queue Length
It’s a stunning and adrenalizing picture, isn’t it? Especially considering it’s a production system with numerous external users across North America.
What does the DBA do first in such a case, aside from saying “Hmm…” and rolling up his sleeves? The DBA checks what’s running on the SQL Server instance, taking into account that the server is dedicated to the database service.
The active processes report showed that basically 2 processes were consuming the server resources: the reindexing procedure and a query (SELECT PageHits.ID AS PageHits, ...) :
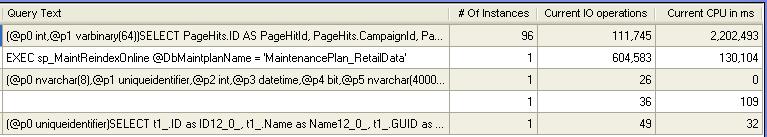
Figure 2. Active processes at one second interval
Seeing the reidex job in the list of consumers was kind of expected because I knew that the maintenance was running on the Sunday morning. However what was shown by the Active Processes report (see the Figure 2) suggested that the reindex was not actually an issue. The IO column of the Active Processes report could be safely ignored for the time being as the identified bottleneck was CPU, not the disk IO system. As long as CPU is the bottleneck then the process with the highest CPU utilization (namely the query SELECT PageHits.ID AS PageHits, ...) was the culprit. In fact it was taking almost the entire CPU resource, while running from about 100 connections at the same time.
As for the reindex job, it was apparently suffering from the system slowness. The reindexing job's log showed that the job started working on another index a half an hour ago and hadn’t finished the index yet. The previous week's reindex log showed that rebuilding this index took just a couple of minutes.
Ok, let's look at the query having such an impressive CPU appetite. It was not a new code in production as the application had no recent changes in production. What's wrong with it now?
The following script is what we use to check execution plans and statistics in the plan cache:
DECLARE @dbname sysname
SET @dbname = 'MyDBName'
SELECT
        OBJECT_NAME(st.objectid, CONVERT(INT, epa.value)) ObjectName
    ,   objtype
    ,   STR(execution_count, 10) ExecCount
    ,   STR(total_worker_time / 1000.0, 12, 1) TotalCpuInMs
    ,   STR(total_worker_time / 1000.0 / execution_count, 12, 1) AvgCpuInMs
    ,   STR(total_elapsed_time / 1000.0 / 1000.0, 12, 1) TotalExecTimeInSec
    ,   STR(max_elapsed_time / 1000.0, 12, 1) MaxExecTimeInMs
    ,   STR(total_elapsed_time / 1000.0 / execution_count, 12, 1) AvgExecTimeInMs
    ,   STR(total_logical_reads, 12) TotalLogicalReads
    ,   STR(total_logical_reads / execution_count, 10, 1) AvgLogicalReads
    ,   creation_time PlanCompilationTime
    ,   GETDATE() CheckTime
    ,   SUBSTRING(st.text, ( qs.statement_start_offset / 2 ) + 1,
                  ( ( CASE qs.statement_end_offset
                        WHEN -1 THEN DATALENGTH(st.text)
                        ELSE qs.statement_end_offset
                      END - qs.statement_start_offset ) / 2 ) + 1) AS statement_text
    ,   qs.plan_handle
    ,   query_plan
    FROM
        sys.dm_exec_query_stats qs
        JOIN sys.dm_exec_cached_plans p
        ON p.plan_handle = qs.plan_handle
        OUTER APPLY sys.dm_exec_plan_attributes(qs.plan_handle) AS epa
        CROSS APPLY sys.dm_exec_sql_text(qs.sql_handle) AS st
        CROSS APPLY sys.dm_exec_query_plan(qs.plan_handle) AS pl
    WHERE
        cacheobjtype = 'Compiled Plan'
        AND attribute = 'dbid'
        AND value IN ( DB_ID(@dbname) )
    ORDER BY
        total_elapsed_time DESC
Script 1. Procedure cache plans and their performance statistics
The script showed a crazy number of logical reads and CPU utilized by the query:

Figure 3. Procedure cache stats for the Query at the time of the congestion
However the execution plan for the SELECT looked good. The query was a join of 5 tables and the execution plan showed all index seeks and no scans.
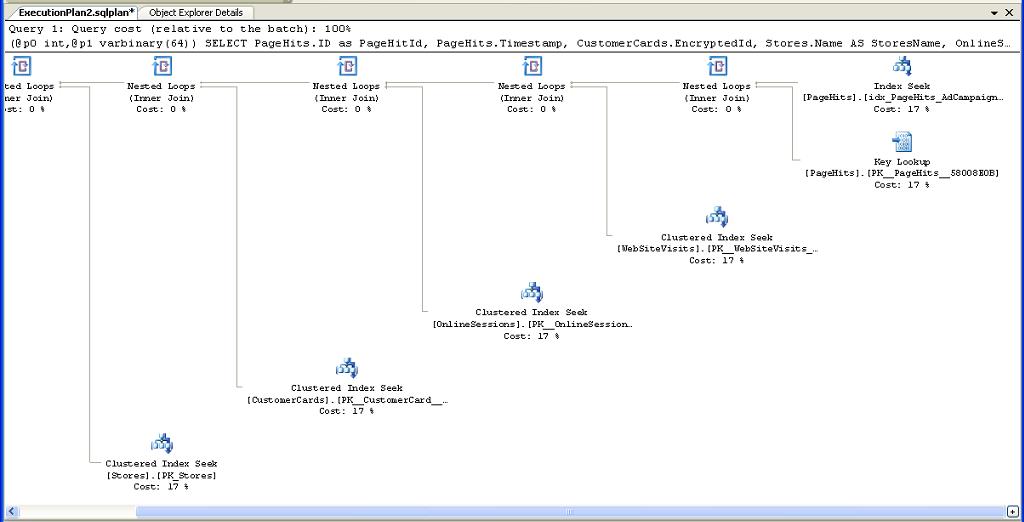
Figure 4. Execution plan taken from the plan cache at the time of the congestion
Employing nested loops could be raising some concerns, but, again, the query was a part of a successfully running release for a long time and has never been a problem.
The default trace capturing the very high Disk IO and CPU consumers also showed a large number of the troublesome queries running on the instance since about one hour ago. I took the query text from the trace to the SSMS Query window, turned on “Include Actual Execution Plan” and executed the query.
The query is a SELECT statement after all; there is no harm aside from hurting performance, which could not be hurt any farther. It took several minutes to complete, proving that something was not right with the server. The execution plan here was the same as the one taken from the plan cache.
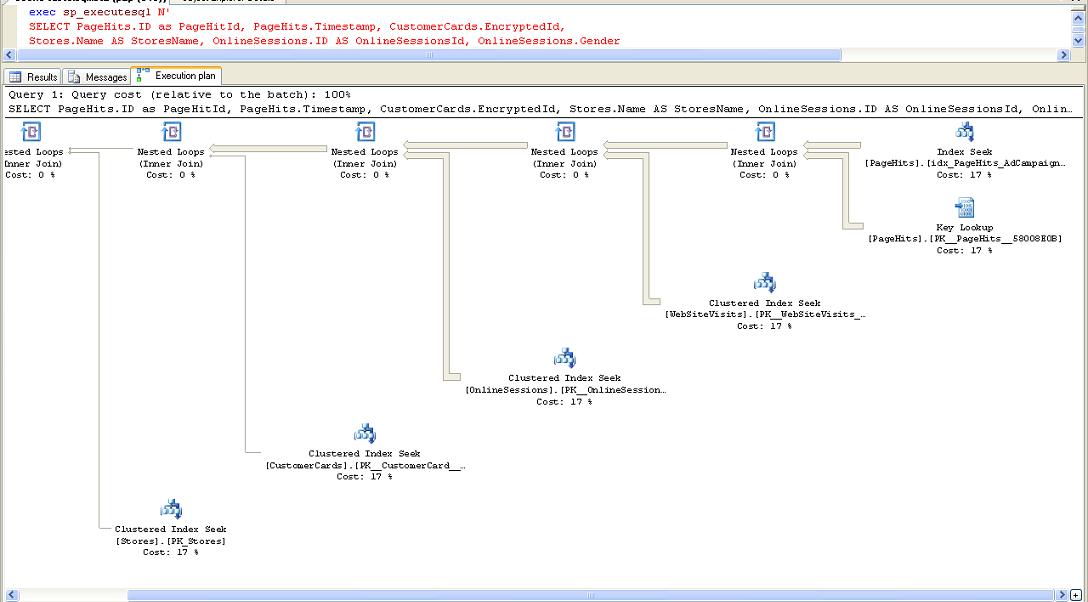
Figure 5. Execution plan when running the query in SSMS
The number of blocks on the system was high, but that was apparently a side-effect rather than a root cause.
The clock was ticking and I had to request that the application team stop their service until the reindex finished, leaving the issue not solved for now. After the reindexing job completed in about two hours, the application service was started again and the troublesome query was running with no problem whatsoever. I checked the stats again and numbers for the query were totally different:

Figure 6. The procedure cache stats for the Query when CPU utilization is normal
The execution plan looked similar, but there was something different in it compared to the plans seen early in the morning.
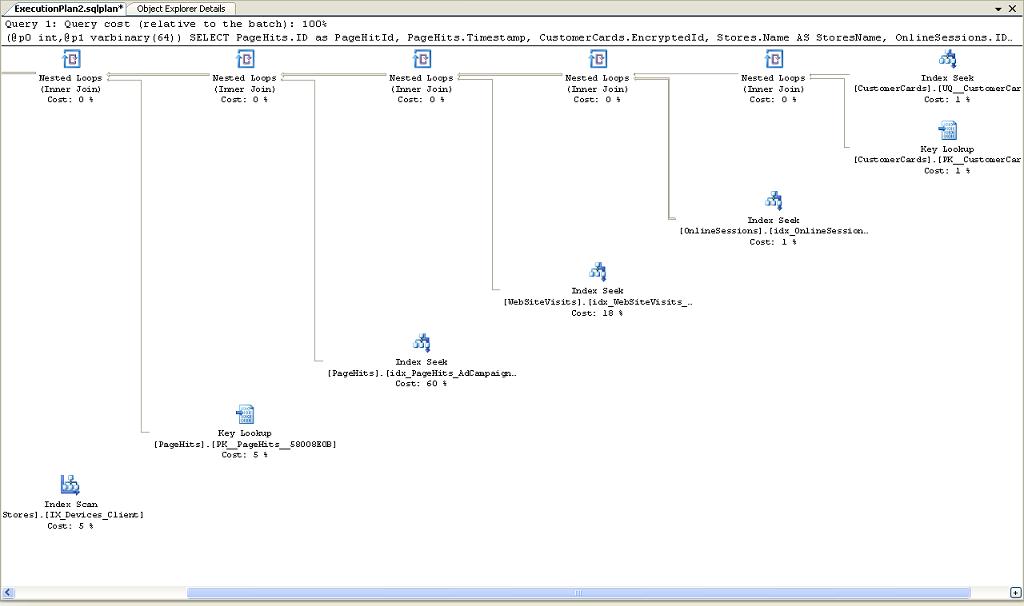
Figure 7. Execution plan taken from the plan cache when CPU utilization is normal
The “good” plan is structured similarly, but the set of indexes is a bit different, and most importantly, the order of nesting the indexes is different. To understand why the order is important we need to compare the sizes of the tables:
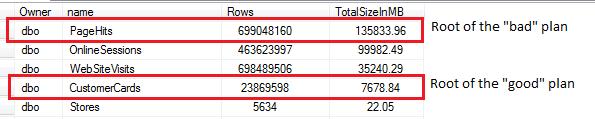
Figure 8. Comparing the table sizes
Building the query around a huge table caused the problem. We’ll take the query to QA a bit later to play with it and to get to the bottom of the issue, but before we do that, let’s look once again at the first two plans captured when running at high CPU. The plans are exactly the same, but an observant reader surely noticed that the lines connecting nodes in the SSMS plan are thicker.
I executed the same query on the same sever at the same time with the same parameters and SQL Server apparently built the same plan, but the dataflow lines are shown differently. Why is that? The answer is: because the plan taken when running from SSMS is actual, whereas the one from cache is estimated. SQL Server estimates that the number of records produced by joining two indexes of the table PageHits is low and if stopping the cursor on the arrow of the cached plan it shows:
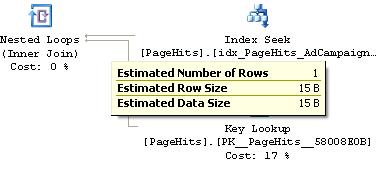
Figure 9. Number of rows in the cached plan
However when doing the same check on the actual execution plan returned by SSMS it’s different:
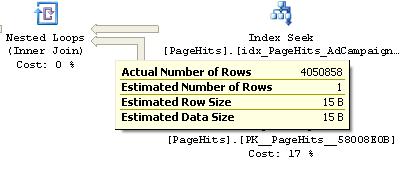
Figure 10. Number of rows in the actual plan
It was a huge clue and I missed it when working in the off-scale-CPU situation.
The observant reader might also notice one discrepancy in the shown performance digits. The cache stats reported the number of executions and CPU utilized by the troublesome query during 54 minutes since the plan was compiled as (see Figure 3):
- PlanCompilationTime: 4:44:51 am
- CheckTime: 5:38:44 am
- ExecCount: 44
- AvgCpu: 24750 (milliseconds)
It means that the total CPU consumed by the query was just 1089 seconds (24.750*44). Considering the box has 32 CPUs, 1,089 seconds constitutes just 1 % of CPU utilization: (1089 /(54*60*32))*100, where 54*60*32 is the total CPU power for the timeframe.
When I noticed it, I was surprised too. Why was the box running at 100% of CPU utilization and the query spotted as the top CPU consumer? I checked the default trace capturing the excessive IO/CPU consumers and found that indeed there was much bigger number of the query executions than the one (44) reported by sys.dm_exec_query_stats. When looking in the trace data the column Duration dragged my attention with something weird in it and that was the answer to the discrepancy:
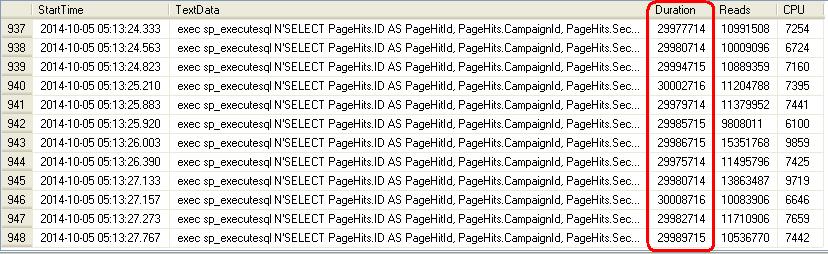
Figure 11. The query duration shown by the trace
Yes, it’s very unlikely that all the queries had execution time exactly 30 seconds. Unless they timed out. We know that the default ADO timeout is 30 seconds. This means that the majority of the queries didn’t finish and neither their execution counts, nor CPU utilization were credited to the execution plan. The plan was credited only for the innocent 1 % of the CPU utilization. This makes us to draw one more conclusion: whatever stats we see in sys.dm_exec_query_stats migt be not accurate if the query times out and does not complete successfully. In our case the inaccuracy is huge.
Reproducing the issue in QA
I took the query to QA to find the reason why SQL Server created different plans. First of all, I saw that the purpose of the troubling query was to show an advertising campaign's details. Let’s call it qryCampaignDetails. The query has two parameters and one of them is CampaignId. It’s the parameter we need to pay attention to because it’s the one used in the root node of the “bad” plan. The index idx_PageHits_AdCampaignId is chosen in the “bad” plan because SQL Server believes that the number of records coming out when selecting the index is low and therefore starting the join with the index is beneficial.
It makes sense to start the join with the smaller tables, so, their resulting small resultset is used to merge with other tables. However the some reason the SQL Server optimizer decided on Sunday morning to use the huge table PageHits to start the join.
Generating different plans in QA was done easily with following the steps:
- Remove the query execution plan from the plan cache. In SQL Server 2008 or higher we can run DBCC FREEPROCCACHE with the parameter plan_handle, whereas in 2005 we can only clean the entire cache.
- Supply CampaignId associated with large number of hits in PageHits table.
- Runs the query and check the plan: it’s a “good” plan (see the Figure 7).
Repeat the same step with different CampaignId value follows these steps:
- Remove the query execution plan from the plan cache.
- Supply CampaignId associated with low number of hits in PageHits table.
- Runs the query and check the plan: it’s a “bad” plan (see the Figure 4).
It’s critically important what parameters are supplied to a prepared query at the first execution. The plan is generated based on the parameters and will stay in cache afterwards until invalidated, which in not going to happen unless there is a change in the involved objects structure or stats and it means it might stay in cache for days.
By the way, both the queries, with “good” and “bad” plan in QA were running very fast, taking just a fraction of a second. It’s because SQL Server selected the best plan for the parameter. However, when after forcing the “bad” plan, i.e. the plan based on the assumption that the number of hit of the campaign is low, I supplied then a CampaignId with large number of hits in PageHits table, the query took very long time, above 2 minutes, even the QA database was 10 times smaller than the production one. Here we go. The effect is reproduced.
Do you know that SQL Server saves the parameters supplied when creating the plan, i.e. the parameters responsible for creating the plan? It does. When I took the plan captured in cache at the time of the congestion, opened it as XML and checked <ParameterList>/ <ColumnReference Column="@p0"> I found that ParameterCompiledValue was 7486. The number of hits in PageHits table for the campaign 7486 is huge. Apparently there was no sense to select the plan based on CampaignId. The only reason why SQL Server did it could be that it “thought” that the number of hit for the campaign is low. The campaign 7486 started recently. It rings a bell. You know that it has something with statistics.
Luckily when checking the cache at the time of the congestion it was recorded the time when the execution plan was created and the time when the database index stats were updated. The update stats time was checked by running the script:
USE MyDBName
SELECT OBJECT_name(OBJECT_ID) TabName,
       name IndexName,
       STATS_DATE(OBJECT_ID, index_id) AS StatsUpdated,
       getdate() CheckTime
 FROM sys.indexes
 ORDER BY 1,2
Script 2. Last statistics update time
I check the stats routinely, but checking this now gave me the key clue.

Figure 12. Fragment of the update statistics report
This report indicates that stats for Stores.idx_Stores_ActiveFlag were updated at around the time of the execution plan compilation, which is (see Figure 3): 04:44:51. This suggests:
- the plan was recompiled as a result of updating stats on Stores.idx_Stores_ActiveFlag
- the stats for IDX_PageHits_CampaignId at time were one week old.
The reindex log helps us to understand why the stats for Stores.idx_Stores_ActiveFlag were updated at 4:44:50 :

Figure 13. Fragment of the reindexing log
The reindex for Stores.idx_Stores_ActiveFlag started as 04:31:44 and took 785.20 sec, meaning it completed at 04:44:49, which correlates with the update statistics time for the index.
All the above is a perfect illustration on how an execution plan is invalidated and recreated when a component defining the plan has changed. We can see the list of conditions to invalidate an execution plan at: http://technet.microsoft.com/en-us/library/ms181055(v=sql.105).aspx.
After combining all pieces of the puzzle, we have the sequence of events causing the issue:
- Reindex (in our case it's rebuild) updated stats of an index (here it’s Stores.idx_Stores_ActiveFlag) involved in the execution plan of the query qryCampaignDetails.
- The execution plan of the query is invalidated (as all other execution plans where the index is involved).
- The next execution of the query qryCampaignDetails creates a new plan and the plan’s structure depends on parameter CampaignId supplied.
- CampaignId for the most recent campaign is supplied as a parameter. SQL Server checks the number of hits associated with the campaign id in idx_PageHits_AdCampaignId stats. The stats show zero hits, because the campaign started this week and the stats are not updated since the last Sunday (the last reindex). It creates the execution plan based on CampaignId. The IDX_PageHits_CampaignId’s turn is somewhere down the lineup for reindexing and only when its turn comes will the hits for the new campaign become “visible” to the SQL Server.
- In fact the number of hits for the new campaign is huge and when the query with the recent campaign is executed it takes lots of time and resources. Considering the queries qryCampaignDetails come with the pace about 6 queries per second, 40 million logical reads per execution kills the server. It does not really hit the IO system because the part of the database related to the campaign has been already pulled to the buffer cache, so instead it kills the CPU.
As I learned later the probability of supplying the most recent campaign was very high and if early that week a new campaign was started, the Reindex-->Bad-Plan-->CPU-100 issue was almost guaranteed. The two weeks of smooth running of reindexing occurred only because there were no new campaigns started.
The issue comes from the fact that IDX_PageHits_CampaignId’s turn for reindexing is behind some other index used in the query and it suggests the solution: make the index IDX_PageHits_CampaignId reindexed first.
The next Sunday morning there was again an “explosion” of the CPU utilization. The permanent solution with changing the reindex order hadn’t been implemented yet, but I had prepared a firefighting fix. The idea was to remove the "bad" execution plan from cache and run the query with the parameters forcing the "good" plan. I cleaned the cached plan, ran the query with the proper Campaign id and guess what? Nothing happened. I checked blocks and found that my query is among many other blocked qryCampaignDetails queries, majority of which were supplying the recent campaign parameters.
The solution didn't work, but there was a solution #2. It came to me on the fly: run update stats on IDX_PageHits_CampaignId. First, this won’t' be blocked. Second, this will invalidate the "bad" execution plan. Third, this will make a "good" plan created if the first query after the invalidation supplies the recent CampaignId, which is most likely the case. This worked like a charm. CPU utilization immediately dropped. Cheers! The goal is achieved.
The Solution
We have both proactive and reactive solution:
The proactive solution is to change the reindex sequence and make the critical index IDX_PageHits_CampaignId reindexed and its statistics updated first. There is a number of other solutions, e.g.:
- To update the CampaignId index stats daily
- To update the index stats before the reindex job (though changing the order does the similar trick).
- To run the entire update statistics job before the reindexing job. Basically we don’t need update statistics for the reindexed indexes (and all indexes are reindexed). However the update statistics job also updates stats for non-indexed columns. The reindex job updates statistics with the same quality (full scan) because it employs rebuild index (not reorganize) and running update statistics job before the reindex would be ok.
- Run qryCampaignDetails with an execution plan hint, e.g. “OPTIMIZE FOR”. This however is not an option in our case as the application is vendor owned and any optimization can be done only by the vendor. Not mentioning that in general hints is not always a good idea.
The reactive solution is to update stats on the index with obsolete stats. If for some reason there is an old campaign with a low number of hits and it is supplied as a parameter after one of the involved indexes has been reindexed, the solution would remove the "bad" plan from cache and the first execution of the query would create a "good" plan.
Conclusion
Today we looked at what might define the logic of the execution plans, why the execution plans can be invalidated and replaced, how to check the plan and how to check the stats details. It was stated that the issue was caused by online reindexing. Is it however purely the online reindexing issue or could all that happen with the offline reindexing as well? The answer is yes, the same problem could happen when running offline reindexing, but normally when running offline reindexing we require the application team to stay away from the database server for the time of the maintenance window, so, in that sense, the issue is the online reindexing issue nevertheless.