

It's fairly common knowledge that deadlocks in SQL Server are caused by a cyclic dependency between multiple processes, threads or sessions, for a set of resources in SQL Server. What most people don't realize is that while there are many different types of deadlocks, the methods used to resolve them all is fundamentally the same. When the deadlock monitor in SQL Server encounters a deadlock, it immediately analyzes the processes contributing to the deadlock and determines which will be the least expensive to rollback. Once this has been determined, that process is killed and a 1205 error is returned to the client.
The first thing to consider when troubleshooting deadlocks is that a deadlock in and of itself is not necessarily a problem. A properly designed and coded application will have exception handling built around all connections to SQL Server that can intercept the 1205 error and resubmit the deadlock victim request back to SQL Server. Generally speaking, the locking scenario that existed to cause the deadlock will not exist during the resubmission and the transaction will complete successfully the second time around. This however, is not actually solving the deadlock, it is just preventing the deadlock from being problematic and causing data/productivity losses to occur.
To properly resolve deadlocks in SQL Server the first that you will need is the deadlock graph. In SQL Server 2005, there are two different ways to get the deadlock graph. The first way to get a deadlock graph is to enable trace flag 1222 which is a newer version of trace flag 1204 which existed in SQL Server 2000 to output deadlock graph information. The output from this trace flag can be a bit complex to follow at first if you are not used to reading the information contained within it. The second way to get the deadlock graph is to use SQL Trace and capture the Deadlock Graph event and save the Deadlock XML Events separately from the trace file. This can be done with SQL Profiler in real time, or with a scripted server side trace which can be turned on and off as needed for deadlock analysis.
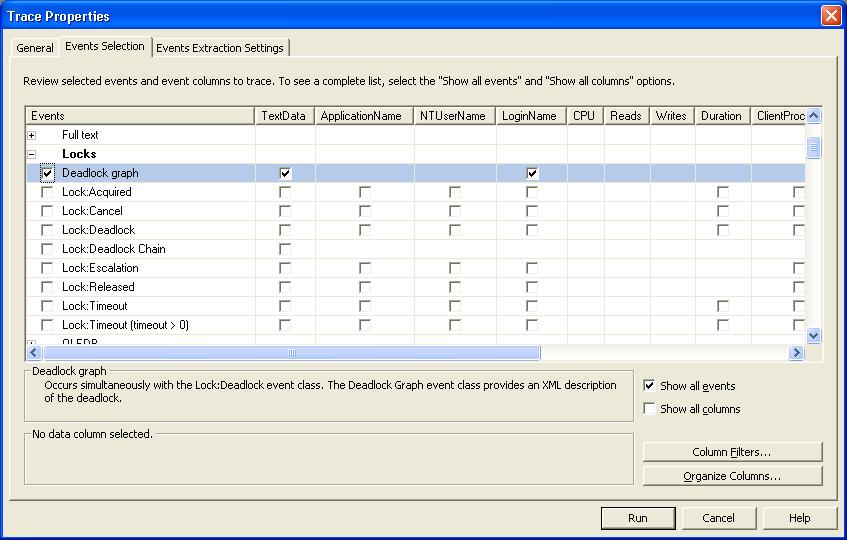
If the deadlocks are fairly frequent and you believe that you can time their occurrence, then using SQL Profiler is really fast and simple. First start up the application and connect to the SQL Instance in question. Then on the Events Selection Tab, add the Locks: Deadlock Graph Event and then remove all of the other events from the trace definition.
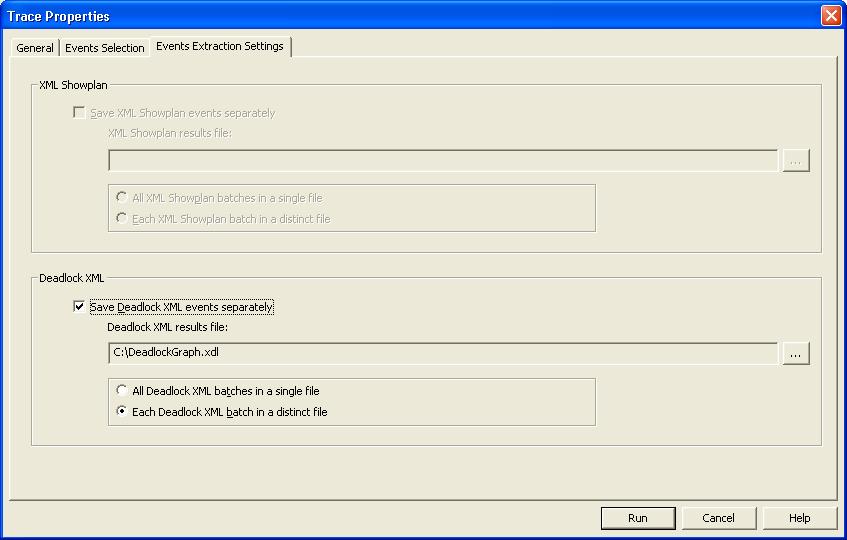
Then click on the Events Extraction Settings Tab, and check the Save Deadlock XML events separately box and specify a path and filename for saving the events to. Then select whether you want to save the events all to one file or to a separate file for each deadlocking batch.
Then start the trace and wait for Deadlocks to occur and be captured by the trace. To simulate one of the more common deadlocking scenarios that I find occurring on the forums, attached to this article is a set of scripts to create a UPDATE/SELECT deadlock against a single table.
To simulate the deadlock first run the setup script. Then open the Selecter script in one window, and the Updater script in a second window. Then run both the Selecter and the Updater scripts. A deadlock will immediately be produced and captured by the Profiler Trace as follows:
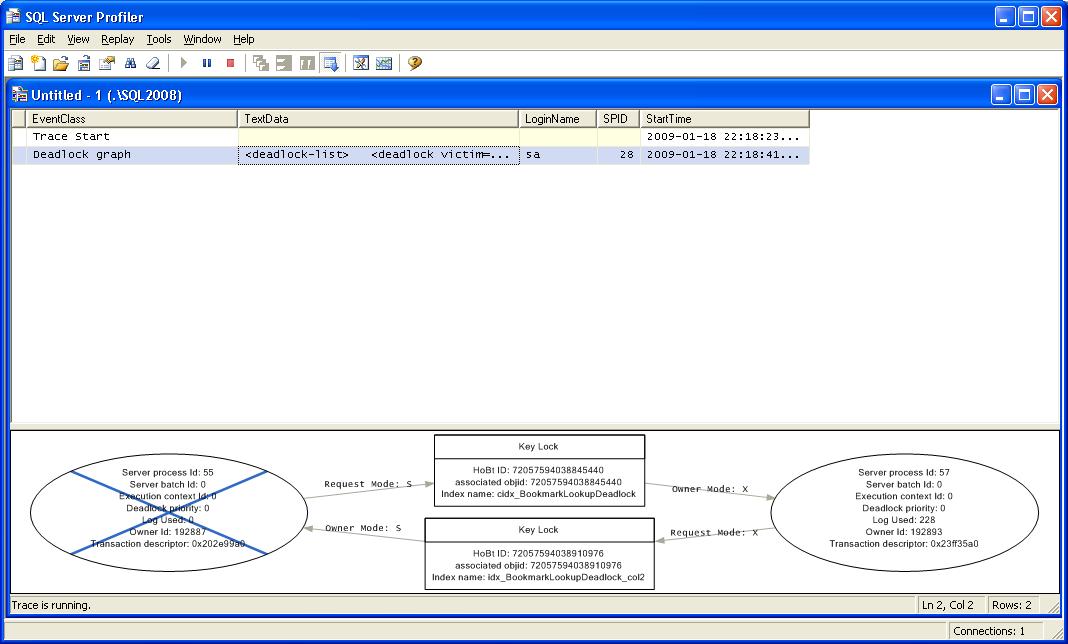
As you can see, we get a nice graphical display of what occurred during the deadlock. In the center are the lock resources involved in the cyclic locking that resulted in the deadlocks. The arrows show the lock owners and requestors and the ovals show the session_id's or SPIDs participating the deadlock. In the case of the above image, SPID 55 which selected as the deadlock victim and was killed. This is shown by the big X over the SPID information. If you hover the mouse over the SPID you can see the statement that was being executed. What this doesn't allow you to do easily is copy the information for further analysis. This is where having the extracted event information in XDL format becomes very helpful.
The XDL files output by SQL Trace/ SQL Profiler are just XML documents that are the same format as the information returned by trace flag 1222. The first place to start troubleshooting deadlocks similar to the one above is to look at the execution plans for both of the contributing processes. In this case, the plan of interest is for the Selecter process as shown below:
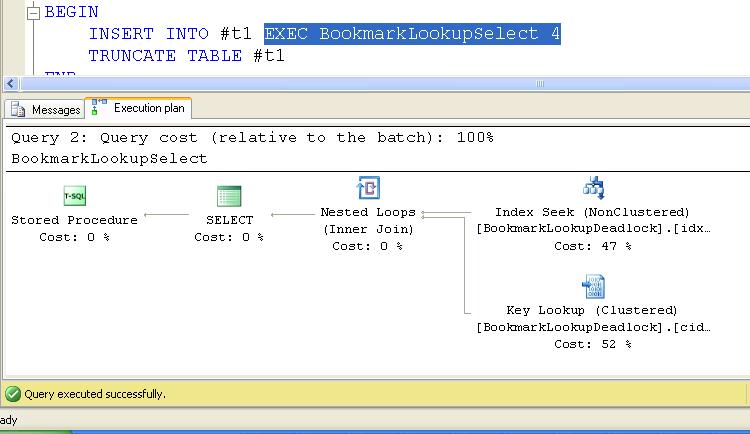
The key point of interest in this Execution Plan is the Key Lookup. When the Selecter process runs, it takes a shared lock on the non-clustered index [idx_BookmarkLookupDeadlock_col2] to maintain concurrency while it reads the data. The problem is that the index is only on one column [col2] and therefore does not contain the necessary columns to completely satisfy the select statement. Since non-clustered indexes also include the clustered index key, they can be used to lookup the missing columns from the clustered index using a Key Lookup operation. This will require a shared lock on the non-clustered index as well as a shared lock on the needed rows in the clustered index.
The deadlock in this type of scenario is completely timing based, and it can be difficult to reproduce without a looping execution as used in the attached demo. The select process gets the Shared Lock on the non-clustered index, and at the same time, the update process gets an Exclusive Lock on the Clustered Index. In order to complete, the select will need a shared lock on the Clustered Index, which is incompatible with the existing exclusive lock so it is blocked until the update completes. However, the update will also require an Exclusive Lock on each of the non-clustered indexes that contain the columns being updated, which is incompatible with the existing Shared Lock held by the select process, so it is blocked. This blocked/blocked situation is the cyclic dependency that will never resolve itself, so the deadlock monitor selects the SPID with the least cost to rollback, in this case the select and kills the session. This frees the non-clustered index for the update to complete.
To resolve this type of deadlock two things can be done. First you can remove the non-clustered index which will result in a clustered index scan to satisfy the select process, which is not ideal, and bad for performance. The other thing you can do is to create a covering index for the select query that contains all of the columns needed to satisfy the query. In SQL Server 2005, this can be accomplished by using the INCLUDED column list in the index definition. For the attached demo, the index definition would be:
CREATE INDEX idx_BookmarkLookupDeadlock_col2_icol3
ON dbo.BookmarkLookupDeadlock (col2)
INCLUDE (col3)
This allows a single index see to occur to solve the select and prevents the cross index lookup from occurring thus preventing the deadlock.
This is but one of many different ways that deadlocks can occur. Usually, deadlocks are caused by a problem in the underlying tables or index structures, by accessing tables in reverse order in code, different isolation levels between the conflicting SPIDs or a combination of all of the above. Even heap allocations with no indexes can be deadlocked against, so the solution isn't to just not use indexing. Even with "proper design" it is still possible to have deadlocking occur which is why it is crucial for applications to properly handle 1205 errors generated by the database engine. If a deadlock occurs, a properly built application should log the occurrence, but also resubmit the deadlocked transaction as a part of handling the error.
