
As I’ve cautioned throughout this Stairway, you should be careful when running Profiler traces against a production server as to avoid impacting performance. In this final level of the SQL Server Tracing Stairway, I’ll compare performance of both Profiler and server-side tracing and discuss why tracing can negatively impact SQL Server performance. Gotchas of each method will be discussed. This will allow you to choose the best tool for the job at hand.
Tracing Performance Impact
Before I describe how tracing can affect SQL Server performance, I’ll show the impact a large trace can have on an OLTP workload. I used a workload generation tool to simulate the activity of a moderately busy server. The tool executed a trivial stored procedure (that performed only SELECT operations) via multiple connections at a constant rate of 5,000 per second. Just like a typical application with connection pooling, the workload generator opened a database connection, executed the stored procedure and closed the connection for each stored procedure invocation. I ran a T-SQL Replay trace via Profiler locally, remotely, and finally with a server-side trace to see the performance impact of each method.
The T-SQL replay trace, which I created using the Profiler T-SQL Replay template (http://msdn.microsoft.com/en-us/library/ms175525.aspx), is fairly hefty one. This unfiltered trace includes over a dozen different event types and columns. When run during this workload, the replay trace captured the 6 events below for each invocation of the application stored procedure for a total of up to 30,000 events per second:
- Audit Login (connection open)
- RPC:Starting (start of application stored proc)
- RPC:Completed (completion of application stored proc)
- RPC:Starting (start of internal sp_reset_connection proc)
- Audit Logout (connection close)
- RPC:Completed (completion of internal sp_reset_connection proc)
Figure 1 shows the Performance Monitor graph of batch requests per second before, during and after local Profiler tracing. The rate plummeted from 5,000 to about 700 immediately when the local Profiler trace was started and returned to 5,000 after the trace was stopped. An 86% reduction in overall throughput like this is intolerable for most production systems.
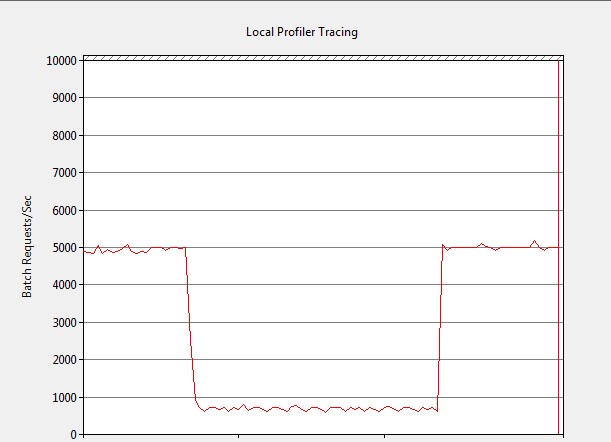
Figure 1: Impact of local Profiler replay trace at 5,000 Batch Requests/sec
Figure 2 shows the same test with remote Profiler tracing. In this case, the Batch Requests/sec rate fell to about 1,000 after the remote Profiler trace was started for an 80% reduction in throughput. Again, this reduction in performance is unacceptable in a production environment.
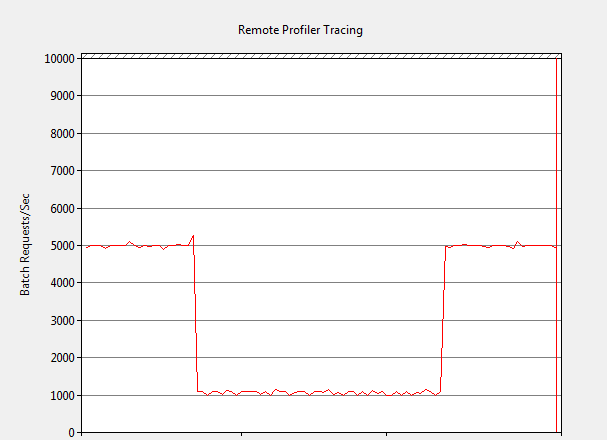
Figure 2: Impact of remote Profiler replay trace at 5,000 Batch Requests/sec
I then ran a server-side trace using the same replay trace scripted from Profiler (Profiler scripting was covered in Level 3 of this Stairway). I observed no discernible impact on performance as Figure 3 shows; the 5,000/sec rate was sustained while the trace was running. I then increased the workload to 10,000 stored procedure executions per second (60,000 events captured/sec). At this high rate, only minimal reduction in throughput occurred. The execution rate never dropped below 9,000/sec and averaged close to 9,800.sec. A minimal impact such as this is acceptable for most production systems. The server side trace was able to capture more than 10 times the number of events without a major performance impact like the Profiler traces.
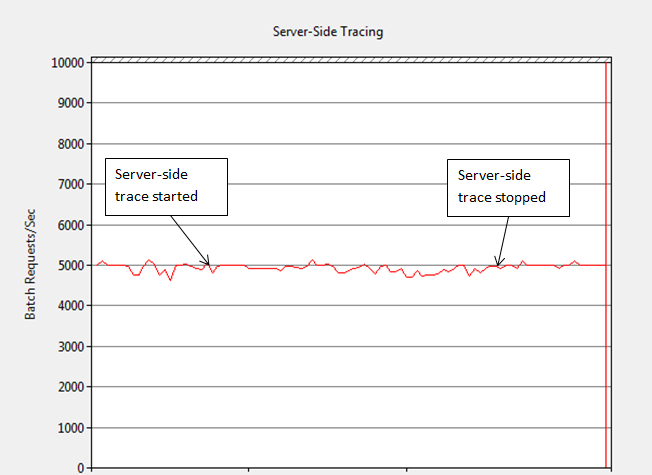
Figure 3: Impact of server-side replay trace at 5,000 Batch Requests/sec
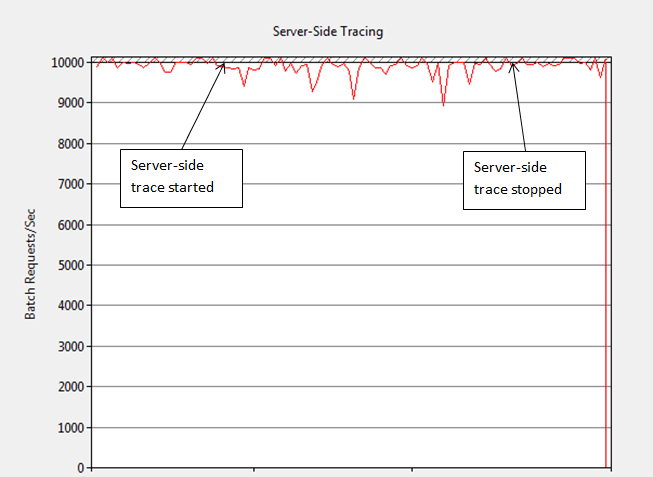
Figure 4: Impact of server-side replay trace at 10,000 Batch Requests/sec
Important TVP Gotcha
Be aware that traces that include events with table-valued parameters (TVPs) containing string columns can result in SQL Server memory pressure and errors if applications don’t specify a maximum length for columns. Tracing allows for a possible 2GB string regardless of the actual size of the TVP column(s) unless applications specify proper TVP column metadata in SQL commands (explicit data types and maximum length specifications are a best practice). The memory used by a trace to build TVP data is acquired from the cache store for temporary objects. You can monitor the OBJECTSTORE_LBSS memory clerk type by querying the sys.dm_os_memory_clerks DMV to identify high memory utilization for TVPs during tracing. (The OBJECTSTORE_LBSS memory clerks manage memory needed for temporary large objects, including intermediate results of expressions and contents of TVPs.). Listing 1 gives you a query that will show this memory usage.
SELECT *
FROM sys.dm_os_memory_clerks
WHERE type = 'OBJECTSTORE_LBSS'
ORDER BY pages_kb DESC;
Listing 1: Query to monitor OBJECTSTORE_LBSS memory clerk
Trace I/O Buffers and Performance
The key to high- performance tracing is maintaining free trace I/O buffers. This applies to both client (e.g. Profiler) and server-side traces. Available buffers allow trace data to be collected as quickly as possible and, more importantly, mitigate performance impact on SQL Server activity when tracing frequently occurring events. Let me review the SQL Trace components as they relate to performance.
Remember from the first level of this stairway that each running trace has separate I/O buffers. The trace controller component inside the Database Engine passes events to each running trace that includes that event. Each trace then applies filters, trims the event to include only those columns requested and passes the final trace data to the trace I/O provider. The trace I/O provider queues the data in I/O buffers and for asynchronous delivery. Importantly, the event producing thread doesn’t need to wait after the event is written to I/O buffers. Asynchronous delivery allows queries to continue without waiting for trace data to be delivered, minimizing the impact of traces on database server performance.
But when the trace I/O buffers are full, the event producing thread waits until I/O buffers are free. This waiting slows response time and effectively results in synchronous trace data collection as the event producing thread (e.g. query) waits until the event can be queued for delivery. On a busy server, queries waiting for trace buffers can quickly cause many cascading negative effects, such as blocking of other queries, deadlocks and worker thread starvation. In a worst-case scenario, improper tracing will result in SQL Server to become unresponsive.
One can generally improve trace performance with frugal tracing. By including only those events and columns needed plus restrictive filters, only trace data required for the particular task at hand are collected. Minimizing the amount of trace data in this way will allow more trace records to be stored in the same number of I/O buffers, this improving efficiency and avoiding full I/O buffers. Nevertheless, even a prudent trace can still run into a buffer bottleneck when high frequency events are collected and can’t be delivered as fast as they are generated. An understanding of the differences of how trace I/O providers deliver trace data is essential so that you can ensure tracing doesn’t adversely affect performance and availability. Let’s examine the differences in trace I/O providers.
Trace I/O Providers and Performance
The trace I/O provider may be either a rowset provider or a file provider. The rowset provider is used by client-side applications like Profiler or a custom SMO application. These applications read trace data as a rowset returned by an internal stored procedure. The tracing application reads rows from the rowset individually, like any other query result.
In contrast with the rowset provider, server-side traces use the trace file I/O provider to write trace data directly to files from the Database Engine. Server-side traces, created with a T-SQL trace script (discussed in Level2) or a SQL Trace Data Collection Set (discussed in Level 9), use the file I/O provider to write trace data directly to files. The file provider doesn’t write trace records to disk individually but instead just fills I/O buffers with trace records. The actual writes to the trace file are done on a separate management thread every 4 seconds using large block writes to maximize throughput.
I/O buffers become full when events are produced faster than read by the rowset provider client or written to disk by the file provider. These two trace I/O providers behave differently when trace buffers are full. The rowset provider waits up to 20 seconds and then removes events from the trace to alleviate the full buffer condition, returning a row back to the client indicating that trace events were skipped. Profiler displays warning message trace skipped records when this condition occurs. However, 20 seconds is a very long time for queries to wait on a busy server and can result in the cascading problems I mentioned earlier.
In contrast with the rowset I/O provider, the file I/O provider doesn’t skip records when I/O buffers are full. Ensuring no events are dropped makes server-side tracing appropriate when complete trace data is important, such as with C2 audit traces. File trace I/O provider buffers become full only when the disk writes can’t keep up with the speed at which trace data are generated. This situation typically occurs only at exceptionally high event rates and the storage system is too slow for the task at hand. As I illustrated in the earlier performance testing, the file I/O provider can typically process many times the event rate of the rowset provider without slowing query performance.
Profiler Tracing Performance Considerations
The choice of where to run Profiler is an important one from a performance perspective. One can run Profiler either locally on the database server or remotely on any machine with the SQL Server Management Tools installed. Both approaches have pros and cons, with the best choice dependent on your environment. I would never generalize that remote Profiler tracing is always better than local tracing or visa-versa. Much depends on environmental particulars, especially processor speed of the machine where Profiler is run, network topology and database server processor headroom.
Remember that Profiler always displays trace data during collection, which is a CPU intensive process that will result in 100% processor utilization of a single core when hundreds of events per second are collected. Before running Profiler locally on the database server, consider that the CPU resources consumed by Profiler could otherwise be used by the database engine. If the database server is already running at high CPU utilization (less than 1 core available), avoid running Profiler locally on the database server.
Local Profiler tracing does have an advantage over remote execution in that it eliminates network latency in returning the trace data rowset, which is especially important with high frequency event traces. But if a remote machine is connected to the database server over a high speed, low latency network connection, network latency may be a non-issue. If your network topology is such that latency is minimal and a remote machine has a fast processor, you may find it better to run Profiler remotely. This was the case with the earlier remote Profiler trace, where the remote box was on the same network segment of a switched 1Gb network.
Be aware that Profiler caches trace data locally during collection using temporary files in the current user profile temp directory (typically on the C drive). This will use space proportion to the total amount of trace data. Ensure you have plenty of free disk space on the C drive before running large Profiler traces.
Summary
It takes only a minute to create a server-side trace, facilitated by the Profiler tool. Proactive trace data collection into a central repository, using the Trace Data Collector or custom ETL process, is a great way to capture data useful for forensic analysis, capacity planning and general troubleshooting.
I recommend a server-side trace instead of Profiler tracing against a production system unless the purpose is a targeted ad-hoc trace of a small number of events (e.g. specific SPID activity) Server-side tracing is much more efficient than Profiler tracing and greatly reduces the risk of introducing problems during troubleshooting. A server-side trace is most often the right tool for the job.
