
Level 6: How to Import Trace Data
T-SQL is a great way to analyze trace data, especially after you’ve collected large amounts of data. You can write queries that filter, aggregate and mine traced data for various events of interest. This Stairway Level will show how to import trace data into a table for ad-hoc analysis using either a server-side trace file or data collected by Profiler as the trace data source.
Importing Server-Side Trace Files into a Table
- Server-side tracing does not allow you to write trace data directly to tables. This restriction ensures server-side tracing collects data as efficiently as possible without burdening the database engine with additional overhead during trace data collection. Fortunately, it is fairly easy to import server-side trace files into a table during or after tracing.
- Let me review the fn_trace_gettable table-valued function. The fn_trace_gettable function takes 2 parameters: a trace file path and a number of rollover files to read. The function returns a rowset that includes all possible trace columns. Columns that were not collected by the trace will contain NULL. One can use fn_trace_gettable as the source of a SELECT…INTO query to create a new table and import trace data, both in a single operation. Listing 1 shows such a query that imports a single trace file, although one can import multiple rollover files for the same trace by specifying a number greater than one, or the keyword DEFAULT, as the second parameter.
SELECT *
INTO   dbo.ImportedTraceData
FROM   FN_TRACE_GETTABLE(N'C:\TraceFiles\MyTrace\MyTrace.trc', 1);
Listing 1: Import trace data into a new table
- Alternatively, fn_trace_gettable may be specified as the source of an
INSERT…SELECTto append trace data to an existing table. The Listing 2 script creates a table with all columns returned by fn_trace_gettable and imports trace data into this universal schema using anINSERT…SELECT…FROMfn_trace_gettable. The DEFAULT keyword is specified as the second function parameter so that all the rollover files are imported at once. AdditionalINSERT…SELECTstatements may be used to append data from additional trace files to the same table. - Some of the trace columns returned by fn_trace_gettable are image and ntext data types (TextData, BinaryData, LoginSid, TargetLoginSid, SqlHandle and PlanHandle). The explicit
CREATE TABLEI use here specifies nvarchar(MAX) and varbinary(MAX) for these columns in order to facilitate querying.
CREATE TABLE [dbo].[ServerSideTraceData]
       (
         [TextData] [nvarchar](MAX) NULL ,
         [BinaryData] [varbinary](MAX) NULL ,
         [DatabaseID] [int] NULL ,
         [TransactionID] [bigint] NULL ,
         [LineNumber] [int] NULL ,
         [NTUserName] [nvarchar](256) NULL ,
         [NTDomainName] [nvarchar](256) NULL ,
         [HostName] [nvarchar](256) NULL ,
         [ClientProcessID] [int] NULL ,
         [ApplicationName] [nvarchar](256) NULL ,
         [LoginName] [nvarchar](256) NULL ,
         [SPID] [int] NULL ,
         [Duration] [bigint] NULL ,
         [StartTime] [datetime] NULL ,
         [EndTime] [datetime] NULL ,
         [Reads] [bigint] NULL ,
         [Writes] [bigint] NULL ,
         [CPU] [int] NULL ,
         [Permissions] [bigint] NULL ,
         [Severity] [int] NULL ,
         [EventSubClass] [int] NULL ,
         [ObjectID] [int] NULL ,
         [Success] [int] NULL ,
         [IndexID] [int] NULL ,
         [IntegerData] [int] NULL ,
         [ServerName] [nvarchar](256) NULL ,
         [EventClass] [int] NULL ,
         [ObjectType] [int] NULL ,
         [NestLevel] [int] NULL ,
         [State] [int] NULL ,
         [Error] [int] NULL ,
         [Mode] [int] NULL ,
         [Handle] [int] NULL ,
         [ObjectName] [nvarchar](256) NULL ,
         [DatabaseName] [nvarchar](256) NULL ,
         [FileName] [nvarchar](256) NULL ,
         [OwnerName] [nvarchar](256) NULL ,
         [RoleName] [nvarchar](256) NULL ,
         [TargetUserName] [nvarchar](256) NULL ,
         [DBUserName] [nvarchar](256) NULL ,
         [LoginSid] [varbinary](MAX) NULL ,
         [TargetLoginName] [nvarchar](256) NULL ,
         [TargetLoginSid] [varbinary](MAX) NULL ,
         [ColumnPermissions] [int] NULL ,
         [LinkedServerName] [nvarchar](256) NULL ,
         [ProviderName] [nvarchar](256) NULL ,
         [MethodName] [nvarchar](256) NULL ,
         [RowCounts] [bigint] NULL ,
         [RequestID] [int] NULL ,
         [XactSequence] [bigint] NULL ,
         [EventSequence] [bigint] NULL ,
         [BigintData1] [bigint] NULL ,
         [BigintData2] [bigint] NULL ,
         [GUID] [uniqueidentifier] NULL ,
         [IntegerData2] [int] NULL ,
         [ObjectID2] [bigint] NULL ,
         [Type] [int] NULL ,
         [OwnerID] [int] NULL ,
         [ParentName] [nvarchar](256) NULL ,
         [IsSystem] [int] NULL ,
         [Offset] [int] NULL ,
         [SourceDatabaseID] [int] NULL ,
         [SqlHandle] [varbinary](MAX) NULL ,
         [SessionLoginName] [nvarchar](256) NULL ,
         [PlanHandle] [varbinary](MAX) NULL ,
         [GroupID] [int] NULL
       ) ;
INSERT  INTO [dbo].[ServerSideTraceData]
       SELECT  *
       FROM    FN_TRACE_GETTABLE(' C:\TraceFiles\MyTrace\ MyTrace.trc ',
                                  DEFAULT) ;
Listing 2: Import trace data into an existing table
The scripts in both Listing 1 and 2 include all 66 columns of the universal trace schema returned by fn_trace_gettable in SQL 2008. SQL Server 2005 has 65 possible trace columns; GroupID was introduced in SQL Server 2008 for the Resource Governor feature. This column list can be pared down to only those you expect to query by specifying an explicit column list on both the INSERT and SELECT clauses, and optionally removing those columns from the target table. But before doing so, consider that you might later find it useful to consolidate data from other traces into the same table or use a set of core scripts to query and manage trace data. You might find that a standardized trace table schema simplifies manageability even though unneeded columns are included.
The fn_trace_gettable function can read any SQL Trace file that the SQL Server service account has permissions to read. The source file(s) can be a previously saved Profiler trace file, the target of an active trace running on the current SQL Server instance or an inactive trace file(s) from either the current or other instances. Remote trace files may be accessed with a UNC name (e.g. “\\SqlServerName\ShareName\TraceFileName.trc”) so that you don’t need to copy the file locally for import.
Importing Profiler Trace Data into a Table
Let me first mention that Profiler allows you to write collected trace data directly to a table by selecting “Trace to table” on the trace property page. At first glance, this might seem like an easy way to avoid a separate import step. But writing trace data to tables from Profiler has performance implications when a significant number of events are collected. Profiler must read each row from the SQL Trace rowset as it is generated, render the data on the screen and write data to the target table, all in near real time. Profiler inserts each row into the target table individually rather than as a set-based or bulk operation. This processing overhead is substantial so I suggest you avoid tracing directly to a table from Profiler except when performance is not a concern, such as in a test environment with minimal activity.
You can save trace results to a table after tracing in a couple of different ways, even if you don’t use Profiler’s trace to table functionality. One method is from the Profiler menu: FileSave AsTrace Table. Profiler will then prompt you for the server, database, schema and table into which the trace data is saved. Note that if an existing table is specified, Profiler will drop the table and create a new one with the same name; Profiler does not allow you to append to an existing table. Like the “Trace to table” method, Profiler inserts rows one at a time so it may take some time to save a large trace with this method. Keep in mind that large traces are better suited for server-side tracing.
The schema of Profiler-created trace tables contains only those columns present in the trace instead of the universal schema of all columns that fn_trace_gettable returns. This is a consideration if you want to combine results from different traces into a single table. You’ll need to write specialized queries to map the different columns of Profiler-created trace tables if the table structures are different.
Rather than save Profiler trace data to a table directly, you can alternatively save to a trace file (FileSave ? AsTrace ? File) and then import the file using fn_trace_gettable, just like you would a server-side trace. This method allows you to append trace data to an existing table without losing previously collected data. Because fn_trace_gettable runs on the SQL Server machine rather than the client, you’ll need to first copy the Profiler trace file to the server or make it accessible via a network share that the SQL Server service account has permissions to read and specify a UNC path as the fn_trace_gettable parameter.
Another advantage of using the fn_trace_gettable method to import Profiler trace data is that the universal fn_trace_gettable schema facilitates consolidating different trace sources into a single table. You don’t have to meticulously track which columns were collected by the source trace in order to import the data.
Analyzing Imported Trace Data with Ad-Hoc Queries
- Ad-hoc queries against imported trace data are a powerful technique that allows one to analyze large amounts of trace data easily. The possibilities are endless, ranging from targeted troubleshooting, capacity planning or workload analysis. I’ll demonstrate using an actual example (modified for illustration) where I explored production SQL Server queries captured during a typical business day to ascertain how applications were actually using the database. I’ve found this sort of open-ended analysis is an excellent way to become familiar with how applications contribute to the overall server utilization and identify issues that might otherwise remain undetected.
- Listing 3 shows a stored procedure that creates and starts an unfiltered server-side trace of all batch and RPC completed events (server-side trace procedures were discussed in Level 2 of this Stairway). I don’t recommend running an unfiltered trace like this on a production server if the server is near capacity or highly transactional (thousands of requests per second) unless you are certain the server has enough headroom to handle the additional load. On this OLTP server, Performance Monitor showed an average of a few hundred batch requests per second with peaks of about one thousand. There was no discernable performance impact while the trace was running.
- I scheduled this procedure to run at 8:00am using a SQL Agent job. The trace stop time (@stoptime sp_trace_create parameter) is calculated as 9 hours from the current time so that the trace automatically stops at about 5:00pm. I also specified a rollover trace with a max file size of 100MB along with a 100 rollover file maximum, thus capping the total disk space used by this trace to 10GB. 10GB is sufficient to hold about 7 million queries for this particular workload. Your actual space requirements will vary considerably depending on the actual size of variable length values like the TextData and ApplicationName as well as the number of queries captured.
CREATE PROCEDURE dbo.StartBatchAndRpcCompletedTrace
AS
declare @rc int
declare @TraceID int
declare @maxfilesize bigint
set @maxfilesize = 100
declare @stoptime datetime
--stop trace 9 hours from now
set @stoptime = DATEADD(hour, 9, GETDATE())
exec @rc = sp_trace_create @TraceID output, 2, N'C:\TraceFiles\BatchAndRpcCompleted', @maxfilesize, @stoptime, 100
if (@rc != 0) goto finish
declare @on bit
set @on = 1
--RPC:Completed columns
exec sp_trace_setevent @TraceID, 10, 15, @on -- EndTime
exec sp_trace_setevent @TraceID, 10, 31, @on -- Error
exec sp_trace_setevent @TraceID, 10, 8, @on  -- HostName
exec sp_trace_setevent @TraceID, 10, 16, @on -- Reads
exec sp_trace_setevent @TraceID, 10, 48, @on -- RowCounts
exec sp_trace_setevent @TraceID, 10, 1, @on  -- TextData
exec sp_trace_setevent @TraceID, 10, 9, @on  -- ClientProcessID
exec sp_trace_setevent @TraceID, 10, 10, @on -- ApplicationName
exec sp_trace_setevent @TraceID, 10, 18, @on -- CPU
exec sp_trace_setevent @TraceID, 10, 11, @on -- LoginName
exec sp_trace_setevent @TraceID, 10, 12, @on -- SPID
exec sp_trace_setevent @TraceID, 10, 13, @on -- Duration
exec sp_trace_setevent @TraceID, 10, 14, @on -- StartTime
--SQL:BatchCompleted columns
exec sp_trace_setevent @TraceID, 12, 15, @on -- EndTime
exec sp_trace_setevent @TraceID, 12, 31, @on -- Error
exec sp_trace_setevent @TraceID, 12, 8, @on  -- HostName
exec sp_trace_setevent @TraceID, 12, 16, @on -- Reads
exec sp_trace_setevent @TraceID, 12, 48, @on -- RowCounts
exec sp_trace_setevent @TraceID, 12, 1, @on  -- TextData
exec sp_trace_setevent @TraceID, 12, 9, @on  -- ClientProcessID
exec sp_trace_setevent @TraceID, 12, 10, @on -- ApplicationName
exec sp_trace_setevent @TraceID, 12, 18, @on -- CPU
exec sp_trace_setevent @TraceID, 12, 11, @on -- LoginName
exec sp_trace_setevent @TraceID, 12, 12, @on -- SPID
exec sp_trace_setevent @TraceID, 12, 13, @on -- Duration
exec sp_trace_setevent @TraceID, 12, 14, @on -- StartTime
-- Set the trace status to start
exec @rc = sp_trace_setstatus @TraceID, 1
finish:
return @rc
go
Listing 3: Procedure to create and start batch and RPC completed event trace
After the trace was finished, I created the trace table shown above in Listing 2 on a test server and imported data using the List 4 script. I used a test server because importing several million trace records is fairly intensive and I wanted to avoid impacting production server performance. The test server SQL Server service account did not have access to the production server share so I moved the raw trace files to the test server C drive before the import. Rather than import all of the trace files in a single INSERT…SELECT transaction, I imported each file individually in a loop. This method avoided filling the test server transaction log. I’ll discuss other techniques to import multiple trace files and automate the process in the next level of this Stairway.
DECLARE
@RolloverFileNumber int = 1
,@TotalRolloverFiles int = 99 --specify actual number of rollover files
,@TraceFileName varchar(255);
--import initial file
INSERT INTO dbo.ServerSideTraceData
SELECT *
FROM    FN_TRACE_GETTABLE('C:\TraceFiles\BatchAndRpcCompleted.trc',1);
RAISERROR('%d rows imported from initial trace file', 0, 1, @@ROWCOUNT) WITH NOWAIT;
--import each rollover file
WHILE @RolloverFileNumber <= @TotalRolloverFiles
BEGIN
SET @TraceFileName = 'C:\TraceFiles\BatchAndRpcCompleted_'
+ CAST(@RolloverFileNumber AS varchar(10)) + '.trc';
INSERT INTO dbo.ServerSideTraceData
SELECT *
FROM    FN_TRACE_GETTABLE(@TraceFileName, 1);
RAISERROR('%d rows imported from rollover file %d', 0, 1, @@ROWCOUNT, @RolloverFileNumber) WITH NOWAIT;
SET @RolloverFileNumber = @RolloverFileNumber + 1;
END
Listing 4: Import trace files script
I gleaned some valuable information with a few simple queries. First, I ran the Listing 5 query to report query statistics by host and application. The results in Figure 1 showed the hosts and applications that issued the most queries along with other pertinent statistics.
--activity summary by host and application
SELECT
HostName
,ApplicationName
,COUNT(*) AS QueryCount
,AVG(RowCounts) AS AvgRowCount
,AVG(CPU) AS AvgCPU
,SUM(CPU) AS TotalCPU
,AVG(Reads) AS AvgReads
,SUM(Reads) AS TotalReads
,AVG(Duration)/1000 AS AvgDurationMs
,SUM(Duration)/1000 AS TotalDurationMs
FROM dbo.ServerSideTraceData
WHERE
EventClass IN(10,12) --Batch and RPC completed
GROUP BY
HostName
,ApplicationName
ORDER BY
QueryCount DESC;
Listing 5: Activity summary by host and application
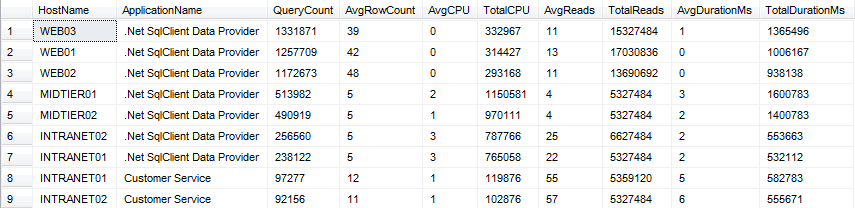
Figure 1: Activity summary results
The hosts that executed the most queries were public web servers. The average query duration was excellent, under 1 millisecond. But that didn’t tell the whole story. I ran the query in Listing 6 to get a sample of the actual queries and reviewed the results (partially shownin Figure 2). I saw that the web code executed the GetProductList stored procedure repeatedly, which accounted for about half of the queries run on the server. This seemed to be much more often than necessary.
I passed these findings to the development team and they found a bug in their code that caused the procedure to be executed on each page hit, even when product data was not needed. Furthermore, since the product list is fairly static, they decided to add a caching layer to avoid most of the remaining calls to this stored procedure entirely. These improvements eliminated millions of queries each day.
--sample queries from specific host and application
SELECT TOP 1000
HostName
,ApplicationName
,TextData
,RowCounts
,CPU
,Reads
,Duration/1000 DurationMs
FROM dbo.ServerSideTraceData
WHERE
EventClass IN(10,12) --Batch and RPC completed
AND HostName = 'WEB03'
AND ApplicationName = '.Net SqlClient Data Provider'
    AND StartTime > '20110414 10:00:00'
ORDER BY StartTime;
Listing 6: Select sample queries from host and application
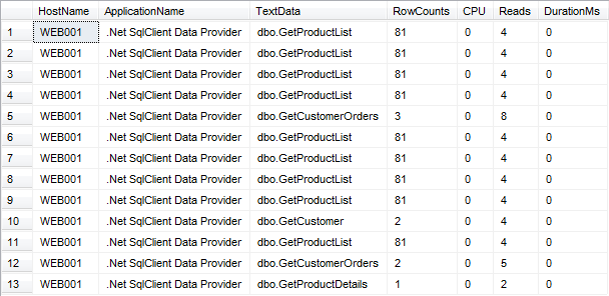
Figure 2: Sample queries from host and application
As you might guess, I found a number of other issues as I delved into the detail data. Most were not particularly serious but easy to remediate. I learned a great deal about the how applications used the database in the process.
Summary
Trace data is a valuable resource that can be saved into a SQL Server table for numerous purposes. Not only is trace data invaluable for identifying and troubleshooting SQL Server performance problems, it can provide insight into how applications are using a database server. This data can be retained in a data mart and/or aggregated for analysis and reporting. In the next level of this Stairway, I’ll show different techniques to automate importing of trace data.
