
Level 10: Troubleshooting
Troubleshooting replication can be a daunting task. There are a lot of moving parts involved in any replication setup and the tools available do not always make it simple to identify a problem. This last level of the Replication Stairway will show you the places that provide the information necessary to solve most problems.
Finding the Problem
Level 9 of this Stairway introduced the Replication Monitor. If you enable all the warnings offered by that tool, it will warn you if something isn’t right. But often that is all the information you can get from that tool. And occasionally, even if you manage to find an actual error message, it is pointing in the wrong direction. To show you how to get more information we will walk through the troubleshooting process of some of the more common issues.
For this example, we work with a transactional replication setup, with one subscriber, where the person who performed the set up forgot to grant any permission to the relevant Windows accounts, and their associated SQL Server logins.
Publication
When you open the Replication Monitor, you will see a lot of red error symbols indicating a problem with the publication, as shown in Figure 1. Drilling down to the Agents tab for the publication reveals that both agents are having a problem.

Figure 1: Publication Agent Errors
Selecting “View Details” in the context menu for the Log Reader Agent entry opens the details dialog, shown in Figure 2.

Figure 2: Log Reader Agent Details
As you can see, there is not a lot more information available here. However, the error message recommends checking out the “agent job history in the Jobs folder”. This refers to the Job History for the SQL Server Agent job that runs the Log Reader Agent.
The history there will look like the one shown in Figure 3.

Figure 3: Log Reader History
Inside the Job History you can see one of the following four symbols next to every execution and every step of each execution:

They indicate: Failure, Success, Running, and Retrying.
For some job steps more than one entry gets logged in the history. If that happens and there was a failure or retry, the last logged row often does not contain any detail. Instead you need to check out the details of the row immediately preceding the last.
In Figure 3, you can see that the agent keeps retrying step 2. You also see more than one entry per step and retry attempt, so to see the reason for the continued retries click on the row immediately preceding the most recent retry indication row. That row is highlighted in Figure 3.
The bottom half of the Job History dialog will now show a detailed message with runtime information about this recent execution. This log text is shown in Figure 4.

Figure 4: Message indicating that the publisher not valid
All the way at the bottom you can see the reason for the failures: The remote server cannot be identified as a valid publisher.
This message is just one of the many things that make troubleshooting replication difficult. It might mean that the publisher you selected is not publishing anymore. In our case, however, it means that the login used by the Log Reader Agent to connect to the distribution database does not have the permissions required to see the publisher information that is stored in the distribution database. (If you need a refresher on the required permissions go back to Level 3 and 4 of this Stairway.)
Granting the missing permissions however seems not solve the problem. The Job History of the Log Reader Agent still shows continuous retires. Checking the log of the newest execution reveals that there is a different problem now: The agent cannot connect to the publication database. This information is again all the way at the bottom, as shown in Figure 5.
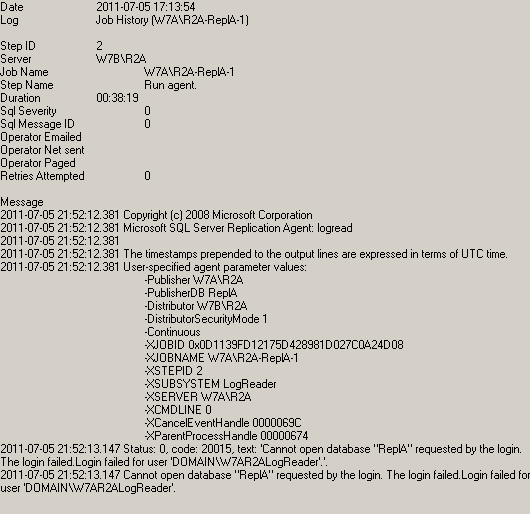
Figure 5: Message indicating that we cannot open publication database
After granting the necessary access to the publication database the Log Reader Agent starts the next execution successfully.

Figure 6: Message indicating that the Log Reader Agent started successfully
Let us turn our attention back to the replication monitor. In Figure 1, both jobs were showing an error condition. However, depending on when this problem came to your attention, the Snapshot Agent might still have shown the “I am running” sign, like the one shown in Figure 7.

Figure 7: Everything running? It depends!
The replication monitor actually relies on the Snapshot Agent to regularly report status information. Only if that report fails to get sent for an extended period of time, the replication monitor will report a problem.
The problem reported in that case is again not very specific. It just states that the Snapshot Agent did not log any progress in 10 minutes. You can see this message by opening the Snapshot Agent detail dialog that is shown in Figure 8.

Figure 8: Snapshot Agent without progress
The error message recommends to check, manually, that records are still being replicated and that the network connections are up. A quick check in the target database reveals that records are not getting replicated. Checking the network connections doesn’t reveal a problem either so we need to look for the real cause of the problem in another place.
The Job Activity Monitor tells us right away that there is a problem with the Snapshot Agent Job. This is reflected in Figure 9.

Figure 9: Snapshot, we have a problem.
Opening the history for the Snapshot Agent Job, as shown in Figure 10, reveals that the problems started in step 2.

Figure 10: Snapshot Agent History
The details for the selected step are given in Figure 11.

Figure 11: Message indicating that the publisher is again not valid
The error message is the same that we saw before in Figure 4. It again means that the account used to connect to the distribution database has not been granted all required permissions.
Unlike the Log Reader and the Distribution Agents, the Snapshot Agent is not scheduled to run continuously, so after every change you need to restart it to see if your change was successful.
The easiest way to restart the Snapshot agent is to drill down to the Agents tab for the publication in question in replication monitor. A right click on the row for the snapshot agent opens the context menu which contains a “Start Agent” entry. This is shown in Figure 12.

Figure 12: Starting the Snapshot Agent
After restarting the snapshot agent it fails right away with a new error. You can see this error in Figure 13.

Figure 13: Snapshot Agent can't open database
This time the Snapshot Agent detail dialog shows an error message that is a little more helpful than the last time. It informs that the login used by the Snapshot Agent does not have access to the publication database. The details of this error are shown in Figure 14.

Figure 14: Snapshot Agent error detail
After granting access to the publication database only the access to the snapshot share is left to do. This problem like the last one can be solved with just the information provided by the replication monitor. It informs of the problem the same way it did for the publication database access problem and the detail of the error reported is shown in Figure 15.

Figure 15: No Snapshot Share Access
After fixing this last problem, the publication is up and running. The Agents tab for our publication in replication monitor informs us that the Snapshot Agent completed successfully after creating a snapshot of two articles while the Log Reader Agent is still running but was able to successfully complete a least one action. This all is shown in Figure 16.

Figure 16: Publication is now working
Subscription
The subscription in this setup however is still not working. Opening the All Subscriptions tab for our publication in replication monitor shows the subscription as uninitialized. You can see this in Figure 17.
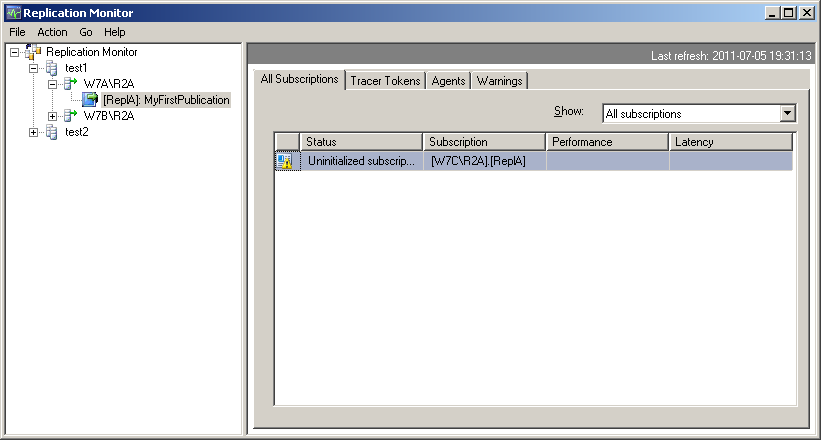
Figure 17: Uninitialized Subscription
To get more information, connect to the subscriber in Object Explorer (in SQL Server Management Studio) and drill down to the subscription. After a right mouse click the context menu opens. This is shown in Figure 18.

Figure 18: Subscription Context Menu
Clicking on “View Synchronization Status” opens a dialog that contains status information about the subscription. This dialog is shown in Figure 19.

Figure 19: Subscription Synchronization Status
This dialog tells us that the distribution agent started successfully and that it is still running. There is no sign of a problem here either, so let’s check out the Distribution Agent job history. You can get there either by using the Job Activity Monitor or by clicking on “View Job History” in the dialog in Figure 19.
From the Distribution Agent Job History we can tell that there is a problem that causes continuous retries. This is shown in Figure 20.

Figure 20: Distribution Agent keeps retrying
The problem details are shown in Figure 21.

Figure 21: Login failed for Distribution Agent
All the way at the end we can see that the Distribution Agent can’t connect to the subscription database.
After fixing that problem we are confronted with the same situation as before. The subscription is still not initialized. To get a meaningful problem description we again have to dive all the way down to the Distribution Agent’s Job History. The Agent seems still to be in an endless retry loop. The error message of the most recent execution is shown in Figure 22.

Figure 22: Distribution Agent can't find the publisher
This error message seems strangely familiar and again it means that the account in question can’t see the available publishers. This time however it is not enough to grant access to the distribution database. To solve this problem the login used by the Distribution Agent needs to be part of the Publication Access List. Check back in Level 4 of this Stairway for details about the PAL.
After fixing this problem we have one last access issue to solve. After having not been very helpful to us trying to work on the previous issues, the replication monitor now wakes up and tells us about the remaining one. This is shown in Figure 23.

Figure 23: Subscription Error
A double click on the subscription with the problem opens the Subscription Detail dialog that is shown in Figure 24.
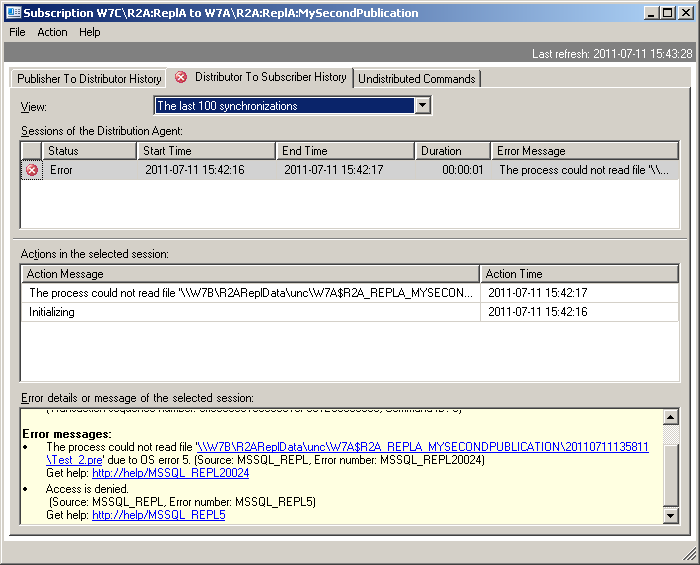
Figure 24: Subscription Error Detail
All the way at the bottom we get to see the reason for the problem. The Access to the Snapshot Share is denied.
After granting the account used to execute the Distribution Agent access to that share, replication finally starts working. Depending on how long it took you to resolve all the issues, you might see a performance warning as shown in Figure 25.

Figure 25: Subscription performance has reached a critical level
That warning however does not need to worry you at this point. It is normal to see some performance alerts right after setting up replication. These alerts usually go away after a few minutes.
Other Tools and Scenarios
While the preceding scenario is not very likely to happen in your environment, it illustrates all the different places where you might need to look to find information about problems. As the setup was a transactional replication setup, all the dialogs shown where specific to that type of replication. However, for merge and snapshot replication you can look in the same places to find the necessary troubleshooting information.
For transactional replication there is one more tool that you should add to your tool box. It is the tracer token. Tracer tokens were introduced in Level 9 of this Stairway. They allow you to measure the latency between the publisher and the distributor as well as between the distributor and the subscriber. But they also can be used to check for problems. If you insert a tracer token and it gets replicated to the subscriber in a reasonable amount of time you can be fairly confident that everything is working. If you regularly insert a tracer token into the stream you can even detect trends like an increasing latency and identify problems before they become painful.
Finally you need to be aware of the fact that sometimes, on rare occasions, the replication monitor can show misleading information. An example is shown in Figure 26.

Figure 26: Misleading information
It looks like everything is working as expected. However, if you look closely you will see that the Latency is “00:00:00”. That is a value that is not very likely to happen in a live system, so if it shows up is might be an indicator of a problem. In this case the subscription did not finish the initialization step, because it for some reason could not find the existing snapshot. The subscription detail dialog showed that the initial snapshot is not available. You can see this message in Figure 27.

Figure 27: Error message for an unavailable, or lost, Snapshot
So while the replication monitor is a very helpful tool, if you have been notified of a problem and the replication monitor is looking like everything is in great shape, make sure to look twice to not miss a suddle hint that could help identifying the problem.
If there is an unresolveble problem in the replicated data, the Distribution Agent will keep trying to resolve it. You can see an example in Figure 28.

Figure 28: Errors indicating problems with the replicated data
This problem is caused by a row that was updated on the publisher but can’t be found on the subscriber. This problem will not resolve by itself, but the Distribution Agent will keep trying and every time it executes, the main screen of the replication monitor shows that everything is running normally. So depending on when you open replication monitor, you might see that there is a problem or you might not. Therefore we again offer this advice: If you suspect a problem, make sure to look a little deeper to not miss something helpful. Here the recent failing synchronizations shown in Figure 28 are an indicator that something is not quite right.
Most problems, like the one metioned above, will show up in the detail dialog for the subscription. The error messages also contains links to information, that can help you with the further analysis of the problem.
Summary
This Level did a walkthrough of a troubleshooting scenario for a transactional replication setup. Several places that provide information helpful for troubleshooting a replication problem were pointed out. At the end some special error scenarios where mentioned.
This Level concludes this Stairway about replication.
If you have comments or questions feel free to contact me at ReplicationStairway@sqlity.net.