
In this Stairway, I will be covering the details of SQL Server transactional and merge replication, from understanding the basic terminology and methodology of setting up replication, to describing how it works and how the basic replication processes can be monitored.
Level 9: The Replication Monitor
The Replication Monitor is a tool that allows you to see the health of all components of a replication setup in one convenient place. This level of the Stairway assumes that you have followed the first eight levels and that you have a merge publication as well as a transactional publication to monitor.
Starting the Replication Monitor
The Replication Monitor is not part of SQL Server Management Studio; it is a separate executable with the name “SqlMonitor.exe”. In a standard installation of SQL Server you will not find the Replication Monitor in the start menu. The easiest way to launch the replication monitor is using Object Explorer in SQL Server Management Studio to connect to the publisher, drilling down to your publication and opening the context menu with the right mouse button. From here, you can start the replication monitor by selecting “Launch Replication Monitor” as shown in Figure 1.

Figure 1: Launch Replication Monitor
Replication Monitor opens with its main screen, which you can see in Figure 2. The screen is split into two parts. The left shows the publisher list, a list of all the publishers you are connected to. If you select one of the publishers you will see more detail about its publications on the right side.

Figure 2: The Replication Monitor Main Screen
Connecting to Additional Publishers
If you started the Replication Monitor by using the context menu of a publication in SSMS, the publisher of that publication will be in the publisher list automatically. If you want to connect to additional publishers you can do so by using the context menu on any folder in the publisher list. In the context menu select “Add Publisher…”. This is shown in Figure 3.

Figure 3: Adding a Publisher within the Replication Monitor
The form that opens allows you to connect to one or more additional publishers. First you need to click the “Add” button which opens a context menu that allows you to pick between connecting to a single publisher and adding all publishers of a specific distributor. This drop down menu is shown in Figure 4.

Figure 4: The The Add Publisher dialog
After making your choice a standard database connection dialog is shown. If you selected to specify a publisher directly and if the distributor for that publisher is a different machine you will see the dialog shown in Figure 5.

Figure 5: Notification when Publisher and Distributor are on different machines
Afterwards you can fill out the standard database connection dialog a second time, this time to provide the credentials for the distributor. You can repeat this process of selecting a publisher or a distributor several times, adding as many publishers to the list as you need.
All publishers you add will show up in the top half of the “Add Publisher” dialog. You can now select – for each publisher independently – the auto refresh interval as well as whether you want this publisher to automatically show up in the publisher list the next time you start Replication Monitor. All publishers that you selected in this dialog will go into the same “group” which shows up as a folder in the publisher list. In the bottom half of the “Add Publisher” dialog you can specify the group you want the new publishers to be added to. This is shown in Figure 6.

Figure 6: Publisher Properties
The groups build a single level folder structure, so you cannot create a group inside of another group.
You can connect to each publisher only once. That means each publisher can be in only a single group at any given time as well. If you are trying to connect to a publisher a second time, the replication monitor will tell you in a friendly dialog that it will not tolerate that attempt.
Publisher Detail
If you select a publisher in the list on the left, the right side will display more information about the selected publisher. The information is displayed in the publisher module in the right pane. It has three tabs.
The first tab is called “Publications” and is shown in Figure 7.

Figure 7: Publications
Here you see a list of all defined publications, their status and their number of subscriptions. The right most three columns contain information about how many subscriptions are currently actively synchronizing data and the performance of the last synchronizations. This performance measurement is based on the performance of all subscribers. It can have the values “Excellent”, “Good”, “Fair”, “Poor” and “Critical”. Performance for transactional subscriptions is only measured if the thresholds have been enabled in the “Warnings” tab (described in the next section ). Merge publication performance is only displayed after at least five synchronizations. See Books Online for more detail.
The second tab of the publisher module contains the “Subscriptions Watch List” and is shown in Figure 8.

Figure 8: Subscription Watch List
The Subscription Watch List gives an overview over all subscriptions for all publications of the selected publisher. With the top left dropdown menu you select if you want to see all transactional, all merge or all snapshot subscriptions. The list of columns is different for each type. More detail about the information included will be given in the sections for each replication type later in this level.
The right dropdown menu allows filtering on problem areas. All available ‘problem area’ options are shown in Figure 9.

Figure 9: Subscription Filter Values
If you select any filter criterion here, only subscriptions that match that filter will be included in the list. This can be a great help, if you are dealing with a lot of subscriptions.
The third tab of the publisher module displays information about the replication “Agents”. It is shown in Figure 10.

Figure 10: Replication Agents Information
In the Agent Types dropdown you can select which types of agents you want to display. The list of available types is shown in Figure 11.

Figure 11: Agent Types
Especially for the log reader agent there is more information displayed here than anywhere else in the Replication Monitor, so this should be the first place to check if you think you are having a problem with the log reader. The information displayed contains the current status, the last start time and the last action performed. For the non-maintenance job types, performance information for the most recent run as well as counts for transactions and commands processed during the most recent run are also included.
Transactional Publications
If you click on a transactional publication in the publication list on the left, the right side will show the transactional subscriptions module. It has four tabs. The first tab is called “All Subscriptions”. It shows a list of all subscriptions for the selected publication. For each subscription you can see the status and also some performance information. Figure 12 shows this list with one subscription.

Figure 12: All Subscriptions for a Selected Publication
The status column shows whether the distribution agent for this subscription is running, not running or retrying after an error. Additionally it can contain warnings like “expiring soon”. The column “Performance” gives a rough overview of the speed of the subscriber and the “Latency” column specifies the time that it takes for a change to replicate from the publisher to the subscriber.
The second tab of the transactional subscriptions module is called “Tracer Tokens”. It is shown in Figure 13.

Figure 13: Tracer Tokens
A tracer token is a special mark that gets written into the log file of the publication database. A tracer token does not cause an actual change to the data in the replicated tables on the publisher or any subscriber. However, this mark looks to the replication agents like a normal transaction. That means, it moves through all the standard replication steps. This allows SQL Server to measure the latency between publisher and distributor as well as between distributor and each subscriber. You can insert a new tracer token by pressing the “Insert Tracer” button. The list will show a single line per subscriber, listing the “Publisher to Distributor” and the “Distributor to Subscriber” latency. The sum of these two values is also displayed in the “Total Latency” column. Information about previous tokens you can retrieve by selecting the date and time when they were inserted in the “Time inserted:” dropdown.
The “Agents” tab of the transactional subscriptions module displays information about the snapshot and the log reader agent. It is shown in Figure 14.

Figure 14: Transactional replication agents
The information includes the SQL Agent Job status, the last start time and the duration of the last started execution which can still be running. You also can see information about the last action that was taken by each agent. Information about the distribution agents is not included in this tab. Where you can get this information will be shown later in this Stairway level.
The last tab of the transactional subscription module is the “Warnings” tab, shown in Figure 15.

Figure 15: Warnings for transactional replication
Warnings are displayed in the status column on the “All Subscriptions” tab as well as with a yellow triangle on all levels of the publisher hierarchy on the left. An example you can see in Figure 16.

Figure 16: Subscriptions with a warning
For transactional replication you can specify two warning thresholds. The first warning threshold is for the expiration warning. If more than the specified percentage of the Maximum Retention Time (see Level 4 for the definition of this term) has passed for a subscriber, this warning will be displayed for that subscriber. The second threshold allows you to receive a warning when the latency exceeds the specified time limit. You can select seconds minutes or hours, and you can type in any number when changing this threshold. Both warnings can be disabled by unchecking the “Enabled” checkbox in front of each.
Merge Publications
If you click on a merge publication in the publication list, the right side will show the merge subscription module. It is shown in Figure 17.

Figure 17: Merge Subscriptions
The merge subscription module features three tabs. They are “All Subscriptions”, “Agents” and “Warnings”. There are no tracer tokens, as the transaction log is not used by merge replication. The “All Subscriptions” tab contains a row for each subscription to the selected merge publication. For each subscription you can see the current status, the Connection type the time and duration of the last synchronization as well as information about performance and delivery rate. The status column can contain these values: Error, Performance critical, Long-running merge, Expiring soon/Expired, Uninitialized subscription, Retrying failed command, Synchronizing and Not synchronizing. The underlined values are considered warnings and might appear combined with a non-warning like Synchronizing. The Performance column can contain the four values “Excellent”, “Good”, “Fair” and “Poor”.
The second tab of the merge subscriptions module contains information about the “Agents”. It contains only the snapshot agent for merge replication. The information displayed is the same as for transactional replication and you can find a picture there (Figure 14).
The last tab allows setting up “Warnings”. It is shown in Figure 18.

Figure 18: Merge Replication Warnings
There are three different warnings that you can choose to receive. One for the expiration of a subscription and two performance related ones. For the performance warnings you can specify a different threshold based on whether the subscriber connects via dialup or is using a broadband connection (which is the reason why there are five rows showing in Figure 18). Warnings for merge subscriptions are displayed in the same way as they are for transactional subscriptions. An example of a transactional subscription with a warning is shown in Figure 16.
Snapshot Publications
Snapshot replication was not discussed in this Stairway. However, you can use the replication monitor to get information about your snapshot publications and subscriptions as well. If you select a snapshot publication on the left, the right side shows the snapshot replication module. It is shown in Figure 19.

Figure 19: Snapshot Publications
The information shown in its three tabs is similar to the information available for merge publications. However, because of the simpler architecture of snapshot replication, the amount of information available is significantly reduced. You have for example no performance information available on the “All subscriptions” tab and the only warning available is the expiration warning.
Subscription Information
Throughout this Stairway level several places where shown that list subscriptions. Everywhere you have a subscription list, you can pull up more information about each subscription by using the context menu. The context menu for a transactional subscription is shown in Figure 20.
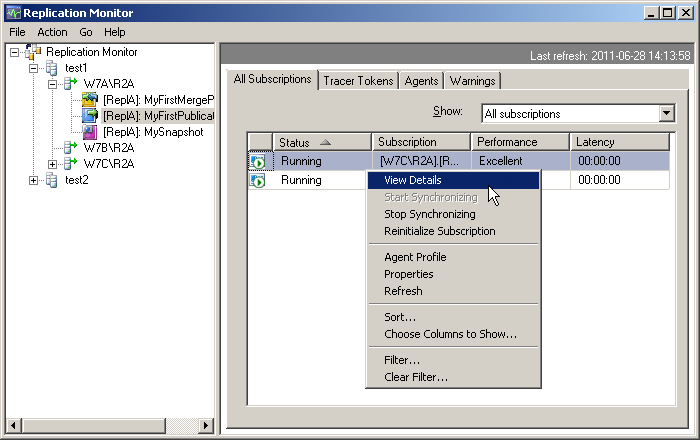
Figure 20: Subscription Context Menu
From here you can mark a subscription to be reinitialized by using an existing or a new snapshot. You can see and change subscription properties and the agent profile. By clicking “View Details” you open a new dialog.

Figure 21: Transactional Subscription Detail
The subscription detail dialog for a transactional subscription features three tabs. It is shown in Figure 21. The first two tabs contain information about the last synchronizations. The first shows the synchronizations between publisher and distributor, the second one the synchronizations between distributor and the selected subscriber. The third tab, shown in Figure 22, contains information about the number of undistributed commands as well as an estimate for the remaining runtime needed to distribute those commands.

Figure 22: Undistributed Commands
For a merge subscription the subscription detail dialog contains only a single tab that shows information about the last synchronizations. This is shown in Figure 23.

Figure 23: Merge Subscription Detail
For each synchronization you can pull up statistical information in the bottom half of the form by selecting the synchronization session in the list.
For a snapshot subscription the subscription detail form also contains only a single tab. It is the same Distributor to Subscriber History tab that was part of the transactional subscription detail form. It is shown in Figure 21.
Alerts
Enabling a warning using the “Warnings” tab for any publication causes the yellow triangle to be displayed when the set threshold is exceeded by one of the subscribers of this publisher. By default no additional action is taken. If you would rather be notified by SQL Server about the problem you can setup a SQL Server Alert. There are several predefined alerts that you can utilize. While you can set this all up using SQL Server Management Studio alone, it is a lot simpler if you use the “Configure Alerts” button on the “Warnings” tab of the publication in question. The warnings tab for a transactional publication is shown in Figure 15. Clicking that button causes the dialog to open that is shown in Figure 24.

Figure 24: Configure Replication Alerts
Selecting any of the listed alerts and clicking the Configure button opens the standard alert dialog, prefilled with the information needed for the selected alert. You can use this form to specify what SQL Server should do and who should get notified when the alert fires. For details on how to use alerts check out Stairway to SQL Server Agent - Level 3: Agent Alerts and Operators.
Summary
In this level the Replication Monitor was introduced. The replication monitor provides a vast amount of information on your entire replication environment. The different dialogs and forms used to convey that information were explained, followed by a brief introduction to SQL Server Alerts.