
You may remember from the first level of this series that the performance benefit from using columnstore indexes can be attributed to two major factors: reduced I/O (caused by column elimination, rowgroup elimination, and compression), and batch mode execution. In all the levels that followed, I have only focused on the I/O reduction. It is now time to switch our focus from I/O to the execution mode. In this level, I will explain what batch mode execution is and how it differs from row mode execution. I will then tell you about some of the limitations of batch mode execution. In the level after this I will focus on techniques you can use to work around the limitations of batch mode execution.
The sample database
All sample code in this level uses Microsoft’s ContosoRetailDW sample database and builds upon the code samples from the previous levels. If you didn’t follow this stairway from the start, or if you did other tests in that database and are now concerned that this might impact the code in this level, you can easily rebuild the sample database. First, download the Contoso BI Demo Database from https://www.microsoft.com/en-us/download/details.aspx?id=18279, choosing the ContosoBIdemoBAK.exe option that contains a backup file. After that, download the scripts attached to this article and execute the one appropriate for your system (either SQL Server 2012 or SQL Server 2014. If you are running SQL Server 2016, I suggest using the 2014 version of this script; keep in mind however that there have been significant changes in this version so many of the demo scripts in this stairway series will not work the same on SQL Server 2016. We will cover the changes in SQL Server 2016 in a later level). Do not forget to change the RESTORE DATABASE statement at the start: set the correct location of the downloaded backup file, and set the location of the database files to locations that are appropriate for your system.
Once the script has finished, you will have a ContosoRetailDW database in exactly the same state as when you had executed all scripts from all previous levels. (Except for small variations in the index creation process that are impossible to avoid).
A basic example
Let’s first run a simple query twice, once in batch mode and once in row mode. I will use the FactOnlineSales table in the ContosoRetailDW database, which has a nonclustered columnstore index. I use this nonclustered columnstore index for two reasons: because this makes it easier to force row mode execution, and because this query works on both SQL Server 2012 and SQL Server 2014. The query in listing 9-1 retrieves some information, aggregated by product, of sales that had a markup of more than 10%.
USE ContosoRetailDW;
GO
-- Run a simple query that will use batch mode
SELECT   ProductKey,
         COUNT(*) AS TotalSales,
         SUM(SalesQuantity) AS TotalQuantity,
         SUM(SalesAmount) AS TotalAmount
FROM     dbo.FactOnlineSales
WHERE    UnitPrice > UnitCost * 1.1
GROUP BY ProductKey;
-- Repeat the same query without parallelism to force row mode
SELECT   ProductKey,
         COUNT(*) AS TotalSales,
         SUM(SalesQuantity) AS TotalQuantity,
         SUM(SalesAmount) AS TotalAmount
FROM     dbo.FactOnlineSales
WHERE    UnitPrice > UnitCost * 1.1
GROUP BY ProductKey
OPTION  (MAXDOP 1);
Listing 9-1: Batch mode and row mode for the same query
As you see, this code runs the same query twice. The first time uses no hints so that the nonclustered columnstore index will be used; the second one adds a hint to prevent parallelism, which in SQL Server 2012 and 2014 disables batch mode.
If you run this code on SQL Server 2012, with the option to include the actual execution plan enabled, you should get a result similar to figure 9-1. (Note that I edited the topmost plan to shorten the arrows, for better readability)
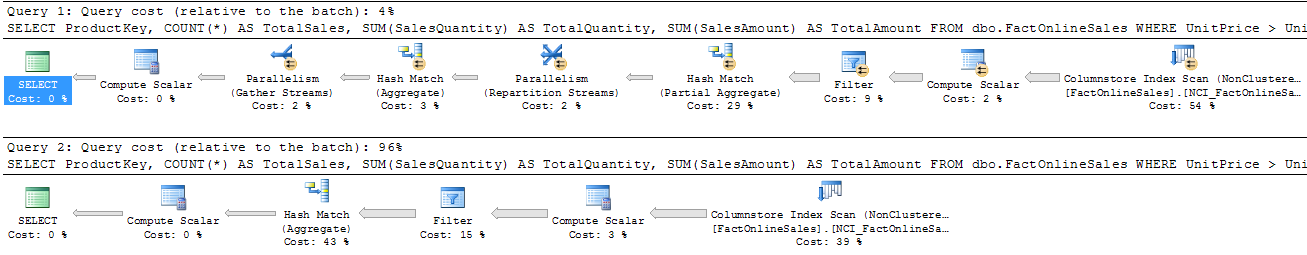
Figure 9-1: Execution plans for batch mode and row mode on SQL Server 2012
If you are using SQL Server 2014, your result will look slightly different, as shown in figure 9-2.
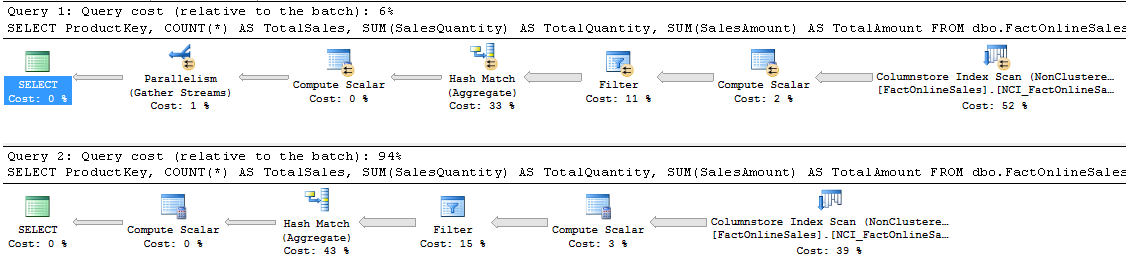
Figure 9-2: Execution plans for batch mode and row mode on SQL Server 2014
Comparing these execution plans, you will see some differences. The serial plan obviously does not have the parallelism markers and the extra “Parallelism” operators; additionally, the parallel plan needs one extra “Hash Match (Aggregate)” operator for optimization reasons that no longer apply in SQL Server 2014.
However, you do not see any differences related directly to the execution mode. That is because those differences, important as they are, are not directly visible in the plan – you have to look at the properties of the various operators to see which are running in batch mode and which are running in row mode. If you click somewhere in the top-most execution plan and then hover the mouse over the filter operator, a tooltip window will pop up, as shown in figure 9-3:
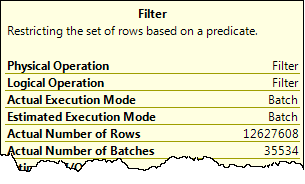
Figure 9-3: Properties tooltip window showing execution mode
This tooltip window shows how this operator executed. The “Estimated Execution Mode’ tells you how the optimizer intended the operator to run; the “Actual Execution Mode” shows how it actually ran. Both of these can be either “Batch” or “Row”, and in most cases they will be equal.
If you repeat this exercise for each of the operators in the plan, you will see that all operators in the second query run in row mode. For the first query, the rightmost four (on SQL Server 2012) or five (on SQL Server 2014) operators run in batch mode; this query is said to be executed in batch mode. You will often get the full performance benefit of batch mode execution even when some of its operators run in row mode; more on that below and in the next level.
Inside the operator
You now know where to look if you want to find out if a query has been using batch mode, and for which operators. But what does it actually mean? To understand that, I first need to explain a bit about how SQL Server executes a query.
Every icon you see in an execution plan represents an operator. Each of those operators can be thought of as a small computer program, highly specialized to perform one single task. These programs do not run by themselves. Like stored procedures in T-SQL, they are not active until they are called. Then they do whatever they need to do to return a result to the caller, after which they return to the inactive state until they are called again.
Let’s walk through an example, focusing on what happens in the rightmost three operators in the plans above when executing in row mode: Filter, Compute Scalar, and Columnstore Index Scan. It starts when the Filter operator is called because its parent operator needs a row. The task of the Filter operator is to check a condition, but it needs data to do the check so the first thing Filter does is to call Compute Scalar, asking for a row. Compute Scalar’s task is to add the result of a computation to a row, but it also needs to have a row, so it calls Columnstore Index Scan. This operator then calls into the storage engine, which grabs a row from the index and returns it to the scan operator, which in turn returns it to Compute Scalar. That operator then does its computation, adds the result of that computation as an extra column to the row, and then passes that row back to the Filter operator. Filter then applies the logical test, to determine whether to reject the row and once more call into Compute Scalar for the next row, or to pass the row back to its parent operator that can then do its processing – until that parent needs the next row and the whole process starts again.
For a computer, passing control (i.e. calling another subprogram or returning from such a call) is relatively expensive. In the above description, you can see that control is passed six times in order to get just a single row processed by the Filter operator. And since there are over 12.6 million rows in the table, that works out to passing control over 75 million times (12.6 million times 6 equals 75.6 million), for this part of the plan.
When executing in batch mode, the start of the story is the same. Filter is called because its parent needs data, and because Filter itself needs data it calls Compute Scalar, which in turn calls the Columnstore Index Scan operator. This operator then accesses the storage engine, but this time it will not request a single row – it requests a so-called “batch”: a collection of multiple rows, stored in an internal memory structure in a format very similar to the on-disk storage format of columnstore indexes. That batch is returned from the storage engine to the scan operator, and from the scan operator to Compute Scalar. This operator then quickly iterates over all the data in the batch and adds the computed column for each row, then returns control to the Filter operator. Filter then loops over all rows in the batch, selects which rows qualify and which rows should be removed, then hands the result over to its parent operator.
We still see control being passed between operators in the description above, but in this case it happens not for each row, but for each batch. If you look at the properties of the operators in the execution plan, you can see how many batches were used (in the “Actual Number of Batches” property). On my SQL Server 2012 test instance, all rows were combined into 35,534 batches. So now the number of times control was passed to get all rows processed by the Filter operator is reduced to 6 * 35,534 = 213,204 times. A huge saving when compared to the 75 million times control was passed when executing in row mode.
This reduction, along with a huge amount of smart optimizations in the actual code used in each of the operators, is what makes batch mode execution so much faster than row mode execution.
How big is a batch?
When looking only at the cost of passing control, you might wonder why Microsoft didn’t simply put a million rows or more in a single batch to reduce this number even further. There is a good reason for that, and that is related to the cost of accessing the data. The fastest way to access data is when the data resides in the CPU cache, but those have a limited size. When the size of the batch exceeds the size of the CPU cache, the operator becomes slower because it has to access data from main memory – a lot faster than reading from disk, but not quite as fast as reading from the CPU cache.
When columnstore indexes were introduced, back in 2012, Microsoft marketing material often described a batch as containing “approximately a thousand” rows. This figure has later been changed to “typically up to 900”. Both of these are, as is often the case with marketing terms, simplified and misleading.
On my SQL Server 2012 test instance, when I look at the operators and divide the Actual Number of Rows by the Actual Number of Batches, I see that I get on average approximately 356 rows in a batch for the query above; on my SQL Server 2014 instance (which runs in a VM) that number drops to 305. For other queries, that figure can be higher or lower. And on your system it will probably be yet a different figure. The actual number of rows in a batch is based on two factors: the amount of data that has to be stored for each row (adding more columns to the query will reduce the batch size), and the hardware you are running on (on a system with a larger CPU cache, more rows can be stored in a batch without exceeding the CPU cache size). For understanding the performance gain of batch mode, it is not really relevant what the exact batch size is; what matters is that the batch mode architecture results in a huge reduction of how often control is passed.
Combining batch mode and row mode
As mentioned before, when a query executes in batch mode it usually does not use batch mode for all operators in the execution plan, but a mixture of batch mode and row mode. This is by design, and in many cases you will get the full performance benefit even if not all operators are executing in batch mode – but there are also situations where the “wrong” operators run in row mode, significantly reducing the performance of the query as a whole.
Consider the query in listing 9-2. It computes the total number of units sold and the total amount for which they are sold, and then adds a ranking to it based on that amount.
USE ContosoRetailDW;
go
WITH SalesPerProduct
AS (SELECT   ProductKey,
             SUM(SalesQuantity) AS TotalQuantity,
             SUM(SalesAmount) AS TotalAmount
    FROM     dbo.FactOnlineSales
    GROUP BY ProductKey)
SELECT   ProductKey,
         TotalQuantity,
         TotalAmount,
         RANK() OVER (ORDER BY TotalAmount) AS Ranking
FROM     SalesPerProduct;
Listing 9-2: A query that combines batch mode and row mode operators
If you run this query on SQL Server 2012 or SQL Server 2014 and check the execution plan, you will get the result as shown in figure 9-4 (for SQL Server 2012) or figure 9-5 (for SQL Server 2014). The shaded area shows which operators run in batch mode; all other operators run in row mode.

Figure 9-4: Combined batch and row mode on SQL Server 2012
In figure 9-4 (which, again, was edited to shorten the arrows between the operators), you can see that only 2 of the total 10 operators run in batch mode. But when you look at the properties of all operators to see how many rows they receive and how many rows they produce, you will notice that the operators running in batch mode are the operators that do over 99.9% of the work for this query. The batch mode portion reads over 12 million rows from the fact table and aggregates that down to just 2528 rows. That tiny set then uses row mode for the rest of the processing.
As can be seen in figure 9-5, the SQL Server 2014 version of this plan is very similar. There have been some simplifications in the row mode part of the plan, but the largest part of the work (reading and aggregating 12 million rows) still occurs in batch mode.

Figure 9-5: Combined batch and row mode on SQL Server 2014
The query and execution plans shown here are an example of “good” mixed mode: all the operators that have to do a lot of the work run in batch mode, and the row mode part of the plan only operates on a small set of data (left over after filtering or –in this case– aggregation).
Unfortunately, there are also situations where operators that have to process lots of rows do not run in batch mode, causing a significant slowdown of your queries. I will show some examples of this in the next level; I will then also explain how this can often be avoided by rewriting the query.
Run-time mode switch
The switches between row mode and batch mode execution shown above are made when the plan is compiled. You can see this because the estimated execution mode (what the optimizer requested) and the actual execution mode (what happened at run-time) of each operator are the same. It is also possible for a query to fall back from batch mode to row mode while the query executes; in that case the estimated execution mode is batch, but the actual execution mode will show as row.
For SQL Server 2012, the most common cause of run-time fallback to row mode is a hash spill condition. (Another condition, very rare, is insufficient accessible working memory) Hash spilling can occur for every plan that uses one or more “hash match” operators, especially when the actual number of rows is much more than the estimated number. This is because the hash match operator uses main memory to store data. When the query starts, it reserves memory based on the estimated number of rows. It cannot request additional memory later, so when it runs out of memory, it has to spill some of the data to tempdb instead of keeping everything in memory, causing a performance hit for any query where this happens. But that hit is worse for queries using batch mode on SQL Server 2012, because that version only supports spilling to tempdb in row mode. As soon as the available memory runs short, execution has to switch to row mode – an event called “bailout”.
USE ContosoRetailDW;
GO
-- Create and populate a temporary version of the DimProduct table
SELECT ProductKey, ColorName, Manufacturer
INTO   dbo.TmpProduct
FROM   dbo.DimProduct;
INSERT INTO dbo.TmpProduct (ColorName, Manufacturer)
VALUES ('Green', 'ZZ Marketing');
ALTER TABLE dbo.TmpProduct
ADD PRIMARY KEY (ProductKey);
GO
-- Add some extra rows
INSERT INTO dbo.TmpProduct (ColorName, Manufacturer)
SELECT      ColorName, Manufacturer
FROM        dbo.TmpProduct;
GO 10
-- Force the bailout (SQL Server 2012 only!!)
DECLARE @MinManufacturer varchar(50) = 'A';
SELECT     dp.ColorName,
           COUNT(fos.SalesOrderNumber) AS NumOrders,
           SUM(fos.SalesQuantity)      AS QuantitySold
FROM       dbo.FactOnlineSales         AS fos
INNER JOIN dbo.TmpProduct              AS dp
      ON   dp.ProductKey                = fos.ProductKey
WHERE      dp.Manufacturer             >= @MinManufacturer
GROUP BY   dp.ColorName
ORDER BY   dp.ColorName
OPTION (OPTIMIZE FOR (@MinManufacturer = 'Y'));
GO
-- Cleanup
DROP TABLE dbo.TmpProduct;
GO
Listing 9-3: Forcing a bailout
To see the effect of a bailout, run the code in listing 9-3 on a SQL Server 2012 instance. Most of the code is for setup; the actual query uses a hint to force the optimizer into estimating far less rows than there will actually be. Without the hint the query runs fine: batch mode for the operators that process a lot of data, and an execution time of 0.6 seconds. With the hint, several operators that are estimated to run in batch mode have an actual execution mode of row (see figure 9-6), and the execution time shoots up to over 200 seconds.
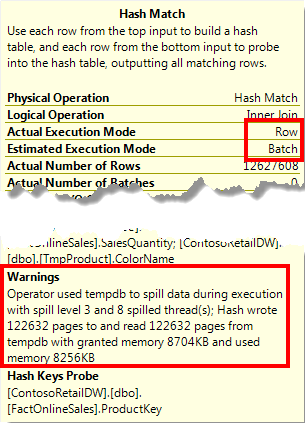
Figure 9-6: Operator properties showing a bailout
If you have to monitor a production server, you cannot capture and inspect actual execution plans for each query that is executed. Luckily there is an easier way to detect when bailout happens, by using Extended Events. The batch_hash_table_build_bailout event fires whenever a hash spill causes execution to fall back from batch mode into row mode.
Note that this problem occurs specifically on SQL Server 2012. Many improvements were made to batch mode execution in SQL Server 2014; one of them was the ability to handle hash table spills without having to bail out of hash mode into row mode.
Conclusion
The tremendous performance benefit of columnstore indexes is built on two principles. The first is reducing the amount of I/O. The second is speeding up the query by using a far more efficient execution model, called batch mode. This execution model reduces the number of times control has to be passed to another module by passing batches of rows instead of single rows between the operators in an execution plan. The operators themselves are also optimized to get the highest possible benefit from CPU.
A query can execute very fast even if not all the operators run in batch mode. The key to getting good performance is that batch mode is used for operators that process millions of rows. For operators that process just a few thousand rows, the performance impact of using row mode instead of batch mode is too small to matter.
Unfortunately, not all operators support batch mode. This causes some queries to run in row mode, forfeiting the possible performance benefit. In the next level, we will look at some of the common query options that inhibit batch mode, and we will show how you can often force batch mode by rewriting those queries.