

In previous installments of the SQLServerCentral.com Best Practices Clinic article series, I focused attention on some very high-level properties of the two-node active/active SQL Server cluster that runs the back-end databases for SQLServerCentral.com and Simple-Talk.com. In this and future clinic articles, I am going to drill down into more specific areas of interest.
In this article, I am taking a brief look at four resource intensive queries that are running on the SQL Server instance that runs the SQLServerCentral.com website. Unlike previous articles in this series, I’d like you to get more involved in making recommendations, such as what, if anything, might be done to optimize the performance of the four queries. In fact, I am going to briefly describe each query and I’ll let you make all the recommendations.
There are many different ways to identify resource intensive queries. The tool I am going to use is SQL Monitor 2.3. One of the new features that were added to version 2.3 of SQL Monitor is the ability to track and identify resource intensive queries over a variety of time ranges. This can be done at the server or the database level. In fact, if you want to check out those queries that are performing poorly at the SQLServerCentral.com and Simple-Talk.com websites, you can visit monitor.red-gate.com, where a live version of SQL Monitor 2.3 is available for you to test out for yourself.
For the purposes of this article, I decided to look for resource intensive queries at the server level, specifically for instance “ins1” of the cluster, which runs all of the backend databases for SQLServerCentral.com. To do this, I opened up SQL Monitor, where I am presented with the Global Overview screen. Then I drilled down until I got to the overview screen for “ins1” (see figure 1 below).

Figure 1: To view resource intensive queries at the server level, go to the overview screen of the server you want to check out.
After scrolling down, I get to the Top 10 Expensive Queries portion of the screen, which is shown below.

Figure 2: The Top 10 Expensive Queries screen.
When you first see this screen, it is set to a default configuration. You can choose to select from a wide range of time periods (although on-line trial version of monitor.red-gate.com only allows you two options), and you can sort by any of the columns displayed on the screen. Different views will help you identify which queries run most often, which have the longest duration, which have the most logical reads, and so on. For the purposes of this article, I have decided to sort the top 10 most expensive queries by the total duration time for the past 24 hours (as shown in figure 2 above).
As I mentioned earlier, I am only going to review the top four most resource intensive queries found on the server. I am limiting this article to only the top four, as I have to keep this article short. Of course, if you were doing this yourself, you could analyze as many of the queries as you have time for. I choose a 24 hour time range because I know that this will cover 99% of all the queries that are run on this server. There are a few weekly jobs that run, and their queries were not captured during the 24 hour period I examined.
So let’s take a look at each of the four most resource intensive queries. After looking at each one, and given your limited knowledge of the query I provide, see if you can come up with any suggestions on how to turn the query, assuming it is even possible. It’s a tough assignment as you have a limited amount of information to work with, but it is not an unrealistic one, as you’re likely to need to diagnose resource-intensive queries that you know little about.
Query #1 & #2
I am going to talk about the top two most resource intensive queries together, as they work together as a team within the SQLServerCentral.com application running on the webserver. The #1 and #2 queries are:
Query #1
UPDATE dbo.AnalysisLog
SET [Count] = [Count] + 1
WHERE [Time] = @RoundedTime
AND [Data] = @Data
Query #2
IF EXISTS ( SELECT 1
FROM dbo.AnalysisLog
WHERE [Time] = @RoundedTime
AND [Data] = @Data )
Here’s a little background on what they do. Both queries are used to help track the number of clicks articles receive on SQLServerCentral.com. When a web page is accessed, Query #2 runs first, looking to see if that particular article has ever been viewed before or not. If not, then another query (which is not in the top 10 list) is run to create a new record where clicks are tracked in a table; but if the article has been clicked on before, then query #1 runs, which increments a counter to track the number of clicks for that page. As you can see from figure 2, both of these queries have a high number of executions, high duration, high CPU usage, and high logical reads over the 24 hour period being analyzed. When you add up the amount of resources used just by these two queries, this is a lot of work for SQL Server.
Let’s learn more about what happens when these two queries run. For these two queries, and the remaining two queries, I am going to show you several screen shots that include: the code that was actually run, the IO statistics output, and the graphical execution plan. Hopefully, this will be enough data for you to decide if any of these queries can be optimized, and if so, how.
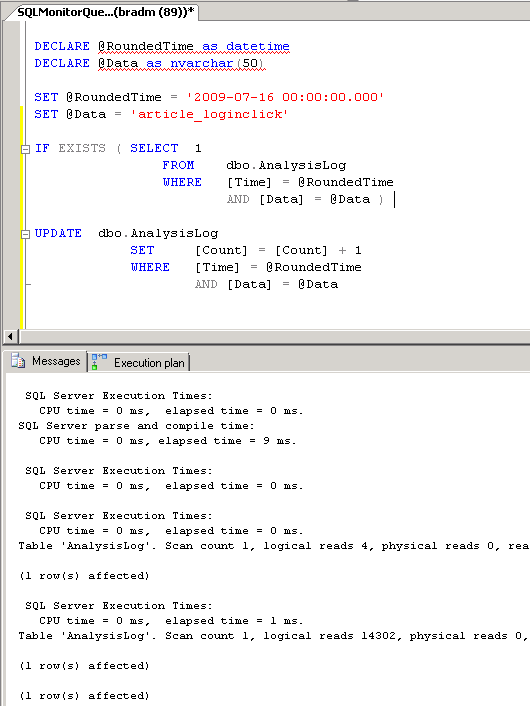
Figure 3: The actual T-SQL with actual data, and the IO STATISTICS results.

Figure 4: The execution plans for query 1 and query 2.
USE [SQLServerCentral] GO CREATE NONCLUSTERED INDEX [] ON [dbo].[AnalysisLog] ([Time],[Data]) USE [SQLServerCentral] GO CREATE NONCLUSTERED INDEX [ ] ON [dbo].[AnalysisLog] ([Time],[Data]) INCLUDE ([AnalysisLogID],[Count])
Figure 5: The suggested missing indexes.
Take a few minutes to review the actual code I ran, which included some required parameters using realistic data; the IO STATISTICs results; the execution plans; and in this case, recommendations for missing indexes. Before you jump to any conclusions on how you might tune this query, you need to know that the AnalysisLog table has a single clustered index on the AnalysisLogID column as its primary key, and no other indexes.
Based on the facts above, what, if anything, would you do to try to optimize these two queries? As you consider this, also try to think outside the box, as perhaps there might be a better way to approach the problem of tracking article clicks that what happens now.
Query #3
Query #3 looks deceptively simple. Its purpose is to help track comments in the SQLServerCentral.com blogs.
INSERT INTO #PageIndex (PostID)
exec sp_executesql @sqlPopulate
If you look closely at the query, you realize that most of the actual code is missing, as it is stored in a parameter. In addition, notice that a temporary table is also required. In order for you to understand what is really happening, I have rewritten the code as you see below, including code to create the temp table, code that assigns various parameters, and changing @sqlPopulate parameter into code that is easily readable. I found all of this information from a Profiler trace so that I could better understand how this particular query works, and to ensure that the data I used for the parameters was typical.

Figure 6: The actual T-SQL and the IO STATISTICS results.

Figure 7: The execution plan.
Take a few minutes to review the actual code I ran, the IO STATISTICS results, and the execution plans. Based on this information, what, if anything, would you do to try to optimize this query?
Query #4
The last of the queries we are examining in this article is the longest of the four, and is used by the SQLServerCentral.com blog to display information about blog authors.
SELECT
F.[SectionID], F.[SettingsID], F.[IsActive], F.[ParentID], F.[GroupID], F.[Name],
F.[NewsgroupName], F.[Description], F.[DateCreated], F.[Url], F.[IsModerated],
F.[DaysToView], F.[SortOrder], F.[TotalPosts], F.[TotalThreads], F.[DisplayMask],
F.[EnablePostStatistics], F.[EnablePostPoints], F.[EnableAutoDelete],
F.[EnableAnonymousPosting], F.[AutoDeleteThreshold], F.[MostRecentThreadID],
F.[MostRecentThreadReplies], F.[PostsToModerate], F.[ForumType], F.[IsSearchable],
F.[ApplicationType], F.[ApplicationKey], F.PropertyNames as SectionPropertyNames,
F.PropertyValues as SectionPropertyValues, F.[DefaultLanguage], F.[DiskUsage], W.*,
null as LastUserActivity
FROM
cs_Sections F, cs_weblog_Weblogs W
WHERE
F.SettingsID = @SettingsID AND
ApplicationType = 1 AND F.SectionID = W.SectionID
Since this query has one parameter, I looked using Profiler to find a typical value and added the necessary code to make the query runnable, as you see in figure 8 below.

Figure 8: The actual T-SQL and the IO STATISTICS results.

Figure 9: The execution plan.
Take a few minutes to review the code I ran, the IO STATISTICS results, and the execution plan. Based on this information, what, if anything, would you do to try to optimize this query?
Put on Your Thinking Caps and Give Us Your Advice
Now that you have seen the four most resource intensive queries on the SQLServerCentral.com website, I would like your input on what, if anything, might be able to be done to help them run using less resources. As encouragement, the best answer I receive for all four queries will win a copy of Red Gate Software SQL Monitor with support and upgrades for a year, as well as a goody bag.
I know this will not be an easy task, but please post your suggestions to the forum using the link below. If you have any questions about these queries, please ask, and I will see if I can find the answers. Like you, I am not intimately familiar with how the code works as I did not write it, but if I can’t answer your question from the top of my head, I will ask and see if anyone else knows more about it. Good luck.
Competition Now Closed
The competition is now closed, and a winner will be announced shorty. Please feel free to read and add your own suggestions - there are some great answers so far!
