

Microsoft and RevolutionR have teamed up to bring the power of R and in-database analytics to SQL Server 2016. This seems to be part of a series of moves by Microsoft to provide rich tools for data science and advanced business analytics including Azure Machine Learning (with flexible integration of both Python and R) and big data database technologies such as DocumentDB, HBase and HDInsight.
Configuring R Services for SQL Server 2016 is a little bit of a maze, with various parts scattered about MSDN. In this article we will try to gather together the simplest and most straightforward instructions from MSDN to get help you get R Services configured. Then we will cover the anatomy of in-database analytics including the connection string, data source, and compute context. First though, there are perhaps two important questions: why R? and, why in-database analytics?
Why R?
R is arguably the language of choice for many statisticians and data scientists and enjoys a vibrant and active community of developers and supporters. Python is perhaps R's greatest rival, with Python's SciKit Learn library providing exceptional machine learning capabilities. However, R still provides the most robust and comprehensive collection of statistical tools. For database developers, R's functional programming style and heavy use of matrices / data frames is a natural fit with the set-based paradigm of SQL.
Revolution R is a proprietary implementation of R that is primarily designed to bring the flexibility of R at an enterprise scale. Revolution R supports the full range of R functionality, including the addition of packages via R's CRAN repository. In addition, Revolution R have redeveloped many of the core features of R to provide high performance parallel processing. Thankfully Revolution R also offer an open edition which we will use in this article.
Reading through the forums and following the discussions on various MOOCs, R can be a challenging language to learn. R's syntax is C-like but with some curious oddities which are unique to R. But more than this, R was primarily designed to do statistics - something it does sensationally well. R provides a rich set of functions and algorithms for statistical analysis in addition to the more typical programming structures. So in addition to the basic syntax, to wrangle R you should expect to learn a reasonable amount of statistics and dedicate yourself to learning to interpret statistical results.
Why In-Database Analytics?
When we think about data processing, we commonly have two options: move the data to the processing nodes or, push the processing out to the data. As we being to tackle larger and larger problems, it becomes increasingly costly to move the data around and instead we need to consider ways of processing the data near to its source. This is the very idea on which MapReduce was founded - minimize the data movement and maximize the use of distributed computing. By pushing analysis out to the database, in-database analytics is able to minimize the costs of data transfer, leverage the performance of the database engine, and allow analysts to run models against much larger datasets than they could on a single machine alone.
Even more powerful perhaps, is that 'in-database' is not restricted to SQL Server. As well as SQL Server, Revolution R has a consistent interface for NoSQL and Hadoop systems which opens the possibility for intelligent big data applications.
Configuring R Services in SQL Server 2016 CTP 3.0
Configuring R Services requires a few different steps, but it shouldn't take long to get up and running. R Services is simply another feature which you can select to install alongside SQL Server, and from there getting up and running is pretty straight forward. In the rest of this article we will very quickly cover the prerequisites and the install process and we will spend more time discussing how to get started with in-database analytics in SQL Server 2016.
Prerequisites & Install
- Prior to this, I had R (version 3.2.1) as well as Revolution R Open installed locally. However, to get R Services to work with SQL Server you will need to install Microsoft R Open. This is well detailed by MSDN (in this article we follow the steps to setup a data science workstation).
- Next, get yourself Revolution R Open (or enterprise) as detailed here.
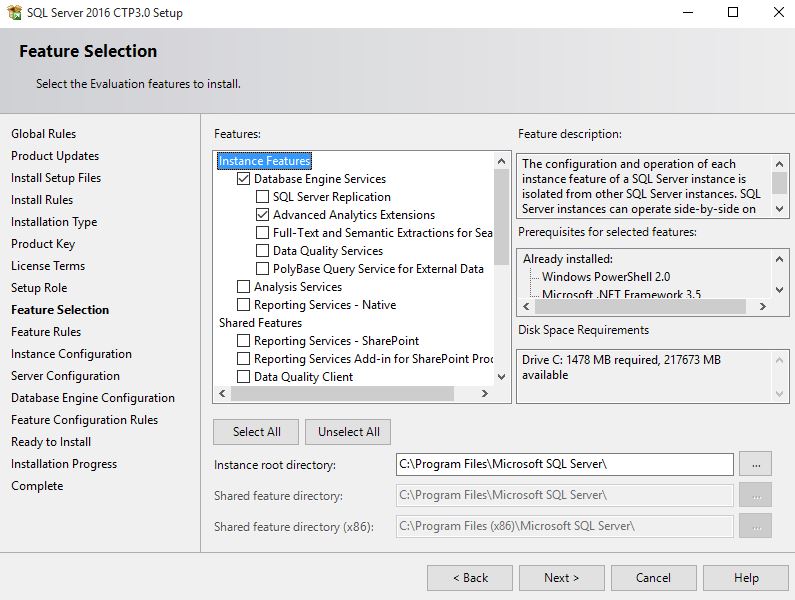
- Download and install SQL Server 2016 CTP 3.0. In the Feature Selection part of the install be sure to select "Advanced Analytics Extensions" along with the other features that you wish to install:

- To configure R Services follow the post-installation steps here to enable external scripts and register the R runtime. Note that we didn't adjust SQL Server's memory settings.
- Finally, to run scripts from Revolution R you will need to setup a SQL user with appropriate permissions. At a minimum this login will require data reader permissions to the appropriate databases. You might also want to consider adding data writer permissions if you want to publish results of models back to the database (e.g. if you are using models to make predictions and you want save these predictions to the database).
In-Database Analytics with Revolution R
If you have managed to get through the setup, then you are ready to develop models in R and run these against the data stored in your database. There are three common ways to run models in R with SQL Server:
- The first method is to connect using an ODBC connection and extract the data in R's working environment. Here though you are limited by your network speeds and the memory constraints of your local workstation.
- The second and third options allow you to perform analyze directly within the database itself either by: developing models in Revolution R and pushing the analysis to the database,
- or by including R code in stored procedures and running these from within the database.
Below we will cover the second option and develop models from Revolution R's IDE and push the analyses out to the database. We will cover the anatomy of in-databases analytics under this model which includes three important things: the connection string, the data source, and the compute context. This discussion extends on the preview of Revolution R Enterprise in SQL Server by Andre de Vries.
The Connection String
Setting up the connection string is relatively straight forward and is little different to setting up a connection string for an ODBC connection. The main difference however, is that you do not need an existing ODBC connection to do this.
Fire up the Revolution R IDE, start a new project and add a new script file. Begin by building a connection string (server / instance name, database, user and password) shown below:
## Declare the Connection String
sql_host <- "SQLTestInstance\\DBANALYTICS"
sql_db <- "AdventureWorksDW2012"
sql_user <- "RUser"
sql_pass <- "<password>"
SQLconnection <- sprintf("Driver=SQL Server;Server=%s;Database=%s;Uid=%s;Pwd=%s",
sql_host, sql_db, sql_user, sql_pass)
The Data Source
Next you need to declare the data source - the table or view which you wish to analyse. According to MSDN, the function RxSQLServerData() provides "improved data connectivity [from R] to SQL Server" (Data Exploration and Predictive Modeling with R). For our example, we have created a view of dbo.FactCallCenter in AdventureWorkDW2012 which we can access from R:
db_data <- RxSqlServerData(
connectionString = SQLconnection,
table = "vw_CallCenter",
colInfo = list( FactCallCenterID = list(type = "integer"),
DateKey = list(type = "integer"),
WageType = list(type = "factor", levels=c("holiday", "weekday")),
Shift = list(type = "factor"),
Calls = list(type = "integer"),
Orders = list(type = "integer"),
AverageTimePerIssue = list(type = "integer"),
DayOfWeek = list(type = "factor")
)
)
There are three parameters passed to RxSqlServerData(). The first is our connection string. The second is the name of the table or view where the data is stored. The third, colInfo, is essentially a table definition for the table / view. If you do not specify the datatypes in colInfo, then R will take the datatypes straight from SQL Server. However, later on we will use regression to predict the number of orders per day, and this requires that the Orders and DayOfWeek columns be treated as categorical data (factors) instead of character data.
The Compute Context
The compute context is what we are really interested in here. Using the function, rxSetComputeContext(), you are telling RevolutionR where and how you would like the data processing to be executed. There are a number of different execution contexts supported at the moment:
-
"RxLocalSeq" -
"local" -
"RxLocalParallel" -
"localpar" -
"RxHpcServer" -
"RxHadoopMR" -
"RxInTeradata" -
"RxInSqlServer"
These options are reasonably self-explanatory: they define where the analysis is to be done (e.g. locally, in Teradata, in Hadoop or in SQL Server) and also define whether to run the operations in parallel or not (in the case of local execution). Revolution R maintain documentation for each of these options, which you can view by typing "??computeContext" in the R console:
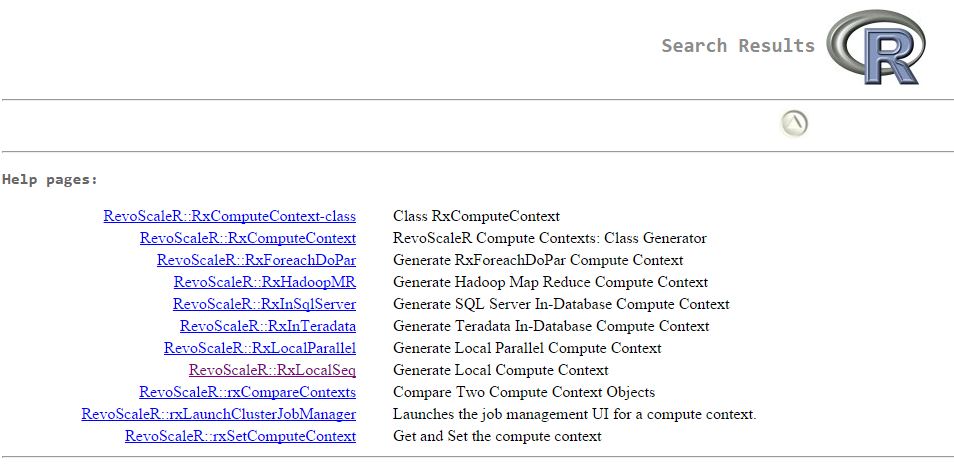
It is interesting looking over these various options. We can see that Revolution R provides a convenient interface to a variety of database technologies and is able to leverage the processing power that is native to each of these. For example, the Hadoop context will make use of MapReduce and the SQL Server context will use the query optimizer (to read data) and the parallel processing power of SQL Server.
There is a slight caveat here as noted on MSDN:
Note that when you set the compute context, it affects only computations that support remote execution context: in other words, R operations provided by the RevoScaleR package and other high-performance analytics provided by Revolution R Enterprise. You cannot change execution context for other standard R computations.
This then is the final step to enable analysis in SQL Server:
rxSetComputeContext(
RxInSqlServer(connectionString = con,
autoCleanup = FALSE,
consoleOutput = TRUE
)
)
Now, any analysis or modeling you perform (using functions from Revolution R) will be run at the database and only results will be returned to the console. Below, we look at a very brief example.
An Example Regression Model
As a simple example on in-database analytics we will run a regression model on the data in FactCallCenter in AdventureWorksDW2012. We will use the connection string, data source and compute context defined above to predict the number of calls received each day of the week:
model <- rxGlm(Orders ~ DayOfWeek - 1, data=db_data, family=poisson)
visual <- function (mx) {
p <- mx$coefficients
s <- mx$coef.std.error
estimates <- data.frame(lower = exp(p - 1.96*s),
expected = exp(p),
upper = exp(p + 1.96*s))
estimates$Day <- rownames(estimates)
return (estimates)
}
m1 <- visual(model)
library(ggplot2)
ggplot(m1, aes(x=Day, y=expected)) +
geom_point(colour="steelblue") +
geom_errorbar(aes(ymin=lower, ymax=upper), width=0.1, colour="darkgrey") +
theme_bw() +
scale_x_discrete(breaks=m1$Day, labels=c("Tues", "Wed", "Thurs", "Fri", "Sat", "Sun", "Mon")) +
xlab("") + ylab("Orders") + ggtitle("Predicted Number of Orders per Day")
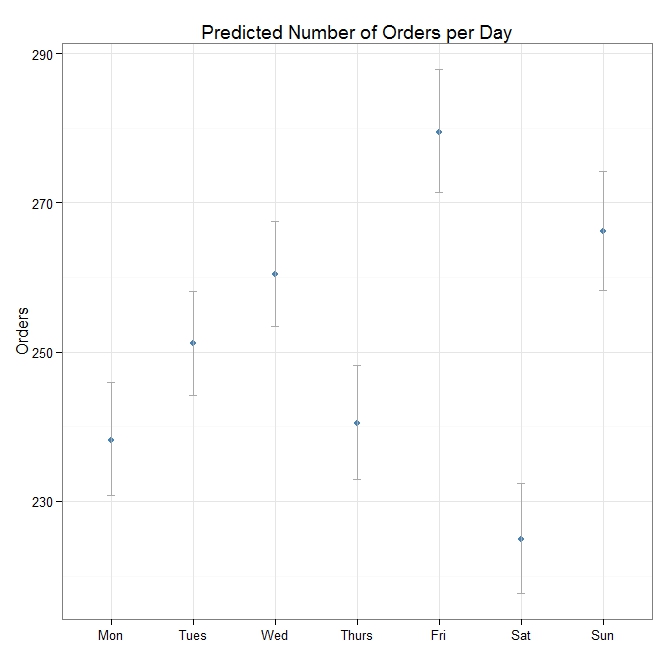
The plot above shows the expected number of orders per day of the week, with 95% confidence intervals. Ideally more work would be required to verify this model and perhaps compare it to other models - but in terms of demonstrating in-database analytics with SQL Server 2016 and Revolution R, I think it serves the purpose.
Final Thoughts
Personally, I think that the integration of R with SQL Server 2016 is an incredibly exciting move from Microsoft. R provides enormous potential to analyze, explore and visualize the data in SQL Server - I can't think of how many times this might have been useful to understand the data or to help identify performance issues from DMVs etc. I do worry about the potential performance costs of in-database analytics and it will be interesting to see how this develops. But on a data warehouse, or a readable secondary perhaps the performance drain won't be too critical. If you're playing around with this too, I would love to know what you think and how you see yourself using this!


