

This is my first article on SQLServerCentral (if you like it, there'll probably be more...). I am a software developer, I deal with SQL Server databases regularly and I've been playing around with R for some time. I even do presentations at SQLSaturdays and other events, which caught Steve Jones' attention, and he asked me if I was interested in writing some articles for SSC. Well, yes, so here we go.
This will not be the absolute beginner's first lesson, so if you wanna play along, I trust you have R and RStudio installed and know what the assignment operator looks like in R. Today's task is to fetch some data from the internet, bring it into shape, und visualize it. As I have no interest whatsoever in football, I went for the next-obvious sport for my data source: the Formula 1 racing series. I attached the R script I use, which hopefully contains the right dose of comments.
First we load a couple of packages.
# Preload needed packages -------------------------------------------------
library(rvest)    # For scraping the web
library(tidyr)    # Functions to tidy our data
library(dplyr)    # Pipe operator, tibble handling
library(ggplot2)  # The Swiss army knife of plotting in R
Remember, if any of the packages is missing on your system, you can install them one-by-one or get the tidyverse family (which I'll probably explain in an upcoming article) in one go:
install.packages("tidyverse")Next up, take a look at the internet site we will get the data from. There is an R function to open it in your browser :-). We find all kinds of distractions, such as buttons, menus and advertisements. Luckily the race result data is formatted as HTML table, so we can easily use some R functions to get the whole HTML construct, isolate the table element, extract just the raw data, and display it.
# Import/ingest the Formula 1 race results for season 2016 ----------------
# Take a look at the data in the browser
browseURL('https://www.formel1.de/saison/wm-stand/2016/fahrer-wertung')
# Fetch the contents of the HTML-table into the variable f1
f1 <- read_html('https://www.formel1.de/saison/wm-stand/2016/fahrer-wertung') %>%
  html_node('table') %>%
  html_table()
# Display our data
f1
So our code has rather nicely separated the data we wanted from those colourful distractions, but it's far from being perfect. The result columns come without any headers, and there are minus signs where we would prefer having zeros. We'll fix that and, for reasons you'll see shortly, we'll cut the results down to the best 9 drivers. Also, for our plot functions to work smoothly, we convert the whole thing to the "long" format.
# Transform & tidy the data -----------------------------------------------
# Add missing column headers
colnames(f1) <- c('Pos', 'Driver', 'Total', sprintf('R%02d', 1:21))
# Convert to tibble data frame and filter on top 9 drivers
f1 <- as_tibble(f1) %>%
  filter(as.integer(Pos) <= 9)
# Make Driver a factorial variable, replace all '-' with zeros, convert to long format
f1$Driver <- as.factor(f1$Driver)
f1[, -2] <- apply(f1[, -2], 2, function(x) as.integer(gsub('-', '0', as.character(x))))
f1long <- gather(f1, Race, Points, R01:R21)
# That looks better
f1long
Now we are ready for some plots, first the "big" picture. The ggplot function is relatively straightforward to use: first parameter is the data frame we want to use. The aethetics basically determine which variables go on the x- and y-axis, optionally which variable to group on and which to colour by. Then we have to state which geometry to plot, in our case a line plot. The rest is some cosmetics, as uncluttering the ticks on the x axis and giving the plot a title.
# Now for some plots ------------------------------------------------------
# Everything in the 'big picture'
ggplot(f1long, aes(x = Race, y = Points, group = Driver, colour = Driver)) +
  geom_line() +
  scale_x_discrete(breaks=c('R01', 'R06', 'R11', 'R16', 'R21')) +
  labs(title = 'F1 race results 2016, top 9 drivers',
       caption = 'source: www.formel1.de')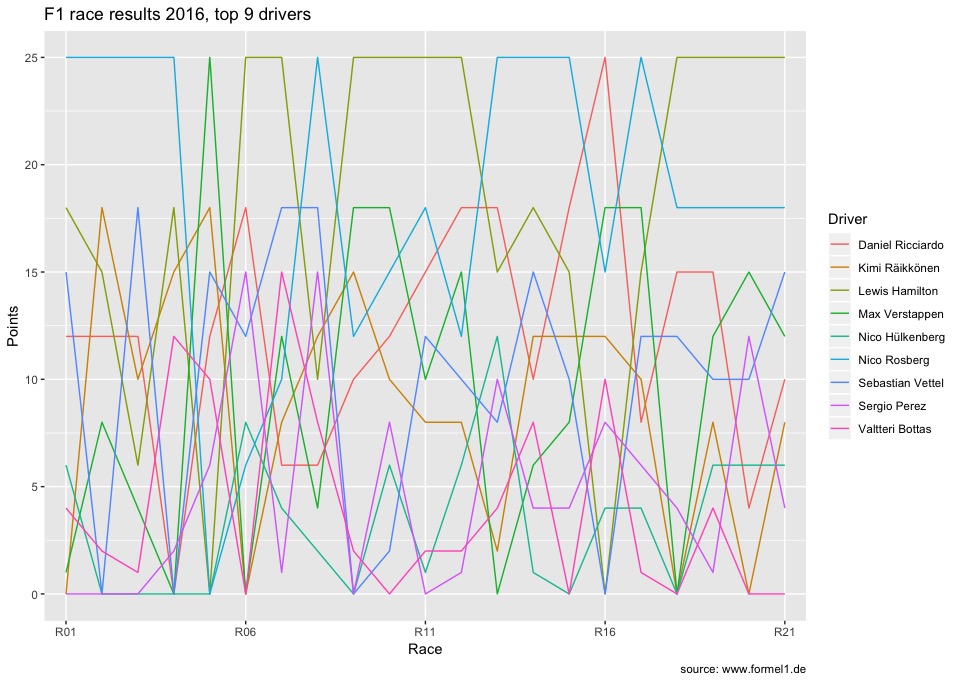
Here we have the 2016 season's results in one plot. Despite having limited our data to the 9 best drivers, it is, well, sort of cluttered. Can we do anything about that? Sure we can... possible solution coming up, something called facetting:
The second plot actually contains the exact same information as the previous one. Just - every driver gets his own small sub-plot, so you can easily follow how each of them performed during the season. And thanks to the auxiliary lines (the white lines originating from each axis tick), the results can still easily be compared to each other.
# Each drivers gets his own
ggplot(f1long, aes(x = Race, y = Points, group = Driver, colour = Driver)) +
  geom_line(show.legend = FALSE) + facet_wrap(~ Driver) +
  scale_x_discrete(breaks=c('R01', 'R06', 'R11', 'R16', 'R21')) +
  labs(title = 'F1 race results 2016, top 9 drivers',
       caption = 'source: www.formel1.de')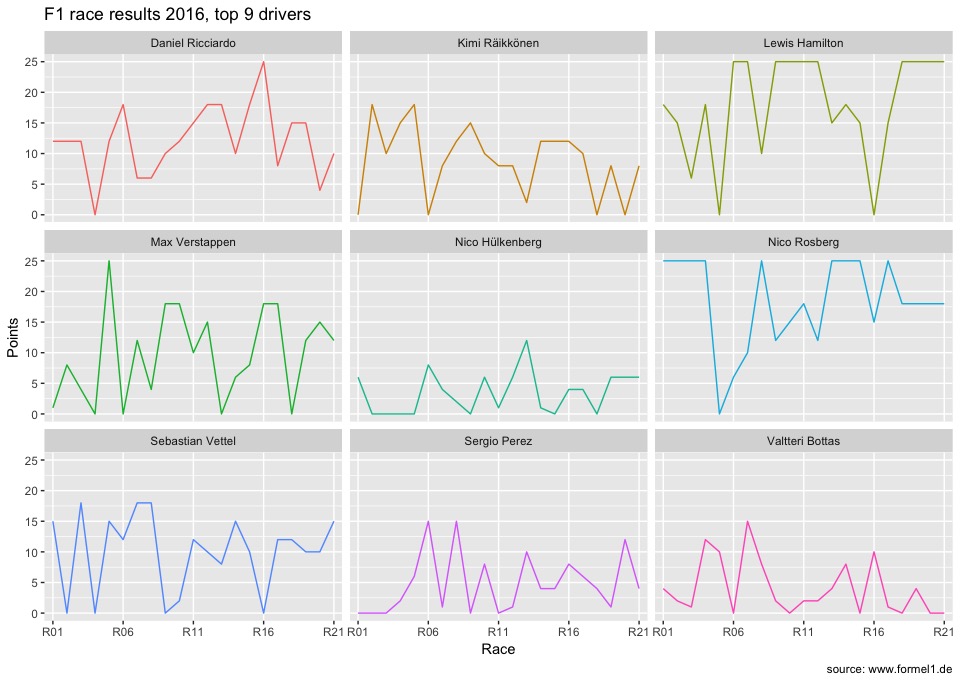
The plots show how each driver performed, that is how many points they gained in the races from 1 through 21. You can see that Ricciardo and Verstappen won one race each, the ones where they gained 25 points. The real top-scorers were Hamilton and Rosberg though, with Rosberg having collected enough points after race 17, he could let Hamilton win the remaining races and still end the season as champion.
I hope I could give you a first impression of what is possible in R with relatively little coding effort. Especially if you look at the ggplot calls: once our data was in shape, those were basically two-liners plus a little cosmetic. We saw that even a data set with just 9 'groups' can be too much for one plot. But then, the step of decluttering the plot consisted only of adding a call to facet_wrap and switching off the legend.
That's it for today. If you enjoyed our little project, please leave a comment. If you didn't like it - please also leave a comment and tell me where I can improve. Thanks for now!