

In machine learning, predictive accuracy is king. We use accuracy measures, such as the mean squared error or absolute error, to train our models and to assess their performance. Let's say we have two models, Model A and Model B with percentage accuracy of 40% and 80% respectively. I think it is natural to compare these two models and say that Model B is twice as good as Model A.
But if these are classification models, this is just not true. Even without additional knowledge of the problem, if we assume that the predictions are sensible and meaningful, then Model B is far more than twice as good as Model A. There is that huge caveat there however, that this is true only if the predictions are sensible and meaningful.
Truthfully, when it comes to classification percentage accuracy is a poor measure of performance. I believe that it doesn't reflect the way that we interpret classification and at the extreme end, percentage accuracies can be simply wrong. We can show this in pictures far better than I can explain...
The Example
Our example is a clustering / classification problem. Technically, these are two different problems - but in my work, I rarely start with classes or labelled data, so I usually use clustering techniques to extract structure and then follow this up with classification techniques for future prediction or inference. For this, I have chosen a nice easy example with three groups:
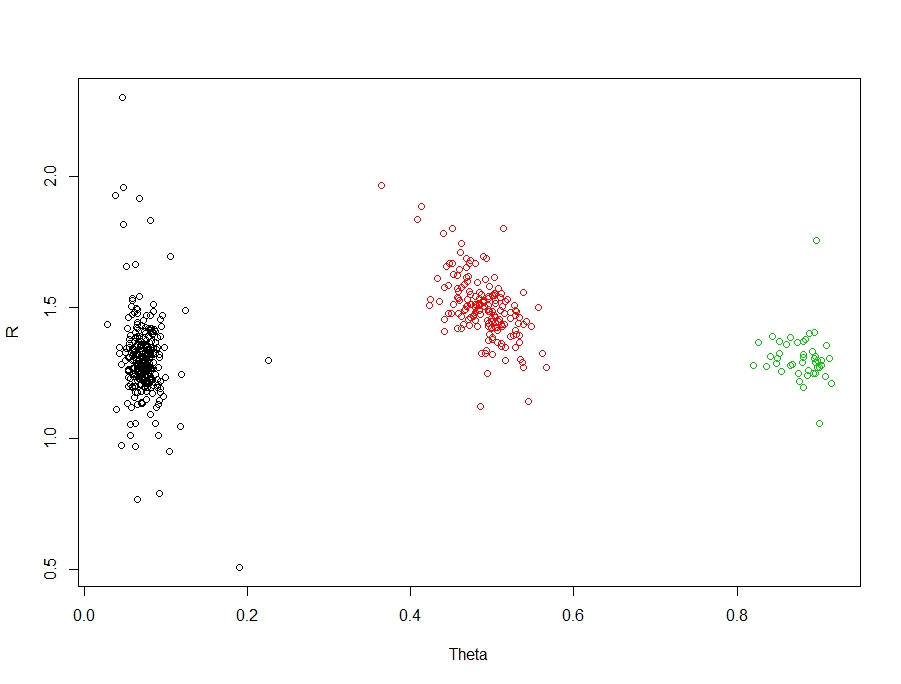
There are three clear and obvious groups in these data. The truth is, this is an easy problem for clustering / classification. But let's create some interesting scenarios and their associated accuracies. First, let's create a function to measure the accuracy:
accuracy <- function (x, n= 100) {
  return (x / n)
}
And now, let's artificially create 4 poor solutions:
par(mfrow = c(2, 2))
# Predict all as the BLACK group
predictions <- rep(1, nrow(data))
score <- accuracy(sum(predictions == data$Classes), n = nrow(data))
plot(data[, c("Theta", "R")], col = predictions, main = sprintf("A: accuracy = %s", round(score, 2)))
# Predict all as the GREEN group
predictions <- rep(3, nrow(data))
score <- accuracy(sum(predictions == data$Classes), n = nrow(data))
plot(data[, c("Theta", "R")], col = predictions, main = sprintf("B: accuracy = %s", round(score, 2)))
# Predict TWO groups
predictions <- ifelse(data$Theta < 0.4, 1, 2)
score <- accuracy(sum(predictions == data$Classes), n = nrow(data))
plot(data[, c("Theta", "R")], col = predictions, main = sprintf("C: accuracy = %s", round(score, 2)))

# Absurd prediction
predictions <- ifelse(data$R < 1.35, 1, 2)
score <- accuracy(sum(predictions == data$Classes), n = nrow(data))
plot(data[, c("Theta", "R")], col = predictions, main = sprintf("D: accuracy = %s", round(score, 2)))
par(mfrow = c(1, 1)) 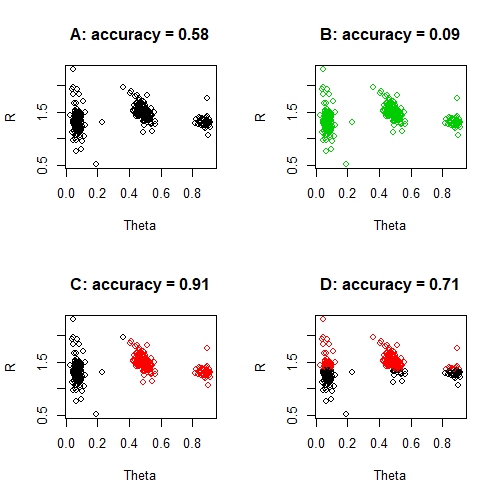
None of the solutions above is a good solution, despite the seemingly great accuracy of solution C. And you certainly can't say that solution D is seven times better than solution B. What is surprising perhaps, is that these solutions aren't entirely unreasonable solutions for certain machine learning techniques either. For example, kmeans could quite reasonably produce solution D if it had a bad run - despite the obvious absurdity of this solution. And a random forest could foreseeably produce solution C, simply because the accuracy is exceptionally good and the misclassified group is so small. In fact, this problem of imbalanced classes is a common problem in machine learning.
What we need, is an accuracy measure which actually reflects our own intuitive assessment of these solutions: entropy. Entropy is a measure of cluster purity. A cluster that is entirely made up of one class is completely pure and will have an entropy of 0. On the other hand, the more mixed up your groups are, the more impure or unstable they are and the entropy quickly rises towards one. Let's create a function to measure entropy and then review our solutions again:
entropy <- function (x, n = 100) {
  p <- x / n
  h <- -p*log2(p) - (1 - p)*log2(1 - p)
  return (h)
}
par(mfrow = c(2, 2))
# Predict all as the BLACK group
predictions <- rep(1, nrow(data))
score <- entropy(sum(predictions == data$Classes), n = nrow(data))
plot(data[, c("Theta", "R")], col = predictions, main = sprintf("A: entropy = %s", round(score, 2)))
# Predict all as the GREEN group
predictions <- rep(3, nrow(data))
score <- entropy(sum(predictions == data$Classes), n = nrow(data))
plot(data[, c("Theta", "R")], col = predictions, main = sprintf("B: entropy = %s", round(score, 2)))
# Predict TWO groups
predictions <- ifelse(data$Theta < 0.4, 1, 2)
score <- entropy(sum(predictions == data$Classes), n = nrow(data))
plot(data[, c("Theta", "R")], col = predictions, main = sprintf("C: entropy = %s", round(score, 2)))
# Absurd prediction
predictions <- ifelse(data$R < 1.35, 1, 2)
score <- entropy(sum(predictions == data$Classes), n = nrow(data))
plot(data[, c("Theta", "R")], col = predictions, main = sprintf("D: entropy = %s", round(score, 2)))
par(mfrow = c(1, 1)) 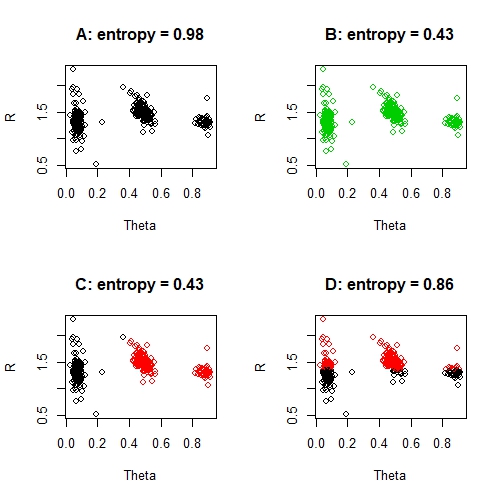
These entropy scores are all very poor, with the exception perhaps of solution C. In particular the 'worst' solution, solution D, has a very poor entropy score. We can also compare entropy scores directly. For example, solution C is twice as good as solution A - and this is sensible: solution C correctly classifies 2 / 3 clusters, where solution A correctly classifies 1 / 3 clusters. Of course, we have to be a little careful with that idea, because solution B is not twice as good as solution A. The issue here, is that the misclassified groups are perfectly misclassified and this is throwing out our entropy measure.
Finally, let me prove that these solutions are not unreasonable. We will run kmeans clustering a number of times and evaluate the results in terms of percentage accuracy and entropy:
par(mfrow = c(2, 2))
predictions <- list()
for (i in 1:4) {
  predictions[i] <- kmeans(data[, c("Theta", "R")], 3)$cluster
  acc <- round(accuracy(sum(predictions[i] == data$Classes), nrow(data)), 2)
  ent <- round(entropy(sum(predictions[i] == data$Classes), nrow(data)), 2)
  plot(data[, c("Theta", "R")], col = predictions[i], main = sprintf("Accuracy: %s Entropy: %s", acc, ent))
}
par(mfrow = c(1, 1)) 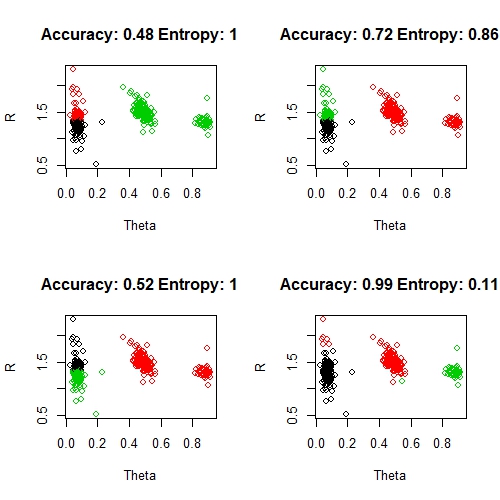
Note, that the class labels (black, red, green) don't necessarily come out an order that matched our original clusters. I have manually tweaked adjusted the labels by making the left-hand group black, the middle red and the far right green wherever possible. I haven't shown this in the code above, it is just a manual hack to get these clusters looking as good as possible. Things to note here:
- for a variety of reasons, kmeans is a terrible clustering algorithm in general (my opinion).
- of these, only the bottom right solution is reasonable and this is reflected by the excellent accuracy and entropy scores
- in four random runs of kmeans, we got four very different solutions and very little consistency in the accuracy scores
- however, there is strong consistency in the entropy scores, which are poor for the first three solutions and good for the last
- despite the quality of the bottom right solution, there are still some obvious problems with the clustering of some of these points (notice the red points by the black group and the one green point under the red group). This is somewhat reflected by the entropy score, but not at all by the accuracy score
Whilst our scenarios here are seemingly contrived, they are not at all unreasonable outcomes for machine learning methods and they perfectly highlight the problems with relying too heavily on percentage accuracy. Overall, I vastly prefer entropy over percentage accuracy as a performance metric for classification and clustering problems. It is a score which is less biased by imbalanced classes, is more consistent across solutions and which better capture the way that we would intuitively interpret accuracy.