

When we think about outliers, we typically think in one dimension, for example, people who are exceptionally tall. Basic statistical tests for outliers (e.g. those in R's Outliers package) are designed specifically for such univariate settings. But in reality, there is usually a wealth of supporting information which will have influence here, for example, "basketball players" tend to be exceptionally tall when compared to the rest of the population, but there are probably also short basketball players if compared amongst other basketball players.
We have the same situation in business datasets, for example, understanding customer behaviours relies on supporting information such as their age, gender, length of history, etc. In these settings, we need methods which can detect outliers across all attributes of a dataset. Statistically, we need multivariate tests for outliers. In this post, we will look at 3 methods for multivariate outlier detection: the Mahalanobis distance (a multivariate extension to standard univariate tests) and two clustering techniques: DBSCAN and expectation maximisation (EM).
The Data
We're going to use one of R's sample datasets, mtcars. The mtcars dataset records details such as miles per gallon (mpg), number of cylinders (cyl) and horsepower (hp) for 32 different cars. You can read the (brief) documentation on this dataset here. The head of the data is shown below:
| mpg | cyl | disp | hp | drat | wt | qsec | vs | am | gear | carb | |
| Mazda RX4 | 21 | 6 | 160 | 110 | 3.90 | 2.620 | 16.46 | 0 | 1 | 4 | 4 |
| Mazda RX4 Wag | 21 | 6 | 160 | 110 | 3.9 | 2.875 | 17.02 | 0 | 1 | 4 | 4 |
| Datsun 710 | 22.8 | 4 | 108 | 93 | 3.85 | 2.320 | 18.61 | 1 | 1 | 4 | 1 |
| ... | |||||||||||
| Valiant | 18.1 | 6 | 225 | 105 | 2.76 | 3.460 | 20.22 | 1 | 0 | 3 | 1 |
A quick look at some selected columns doesn't reveal any startingly obvious outliers:
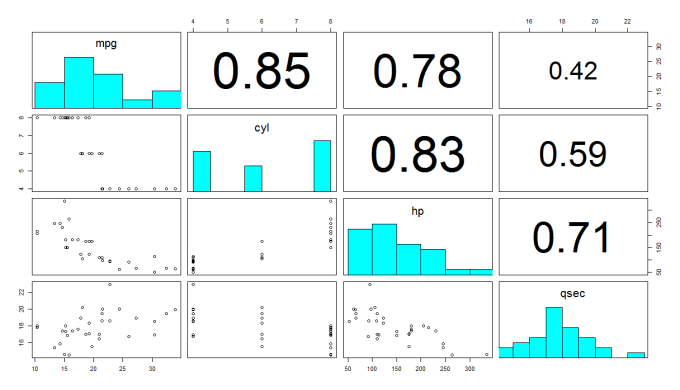
If we squint, there might be some outliers in the hp and qsec column, but there isn't anything truly compelling in these plots. These plots are also a little tough to view all the time, so for the purposes of the rest of this article, we will use principal components analysis to create a simple two-dimensional mapping for visualisation. The code and plot is shown below:
library(ggplot2)
library(data.table)
distance_matrix <- as.matrix(dist(scale(mtcars)))
pca <- prcomp(distance_matrix)
embedding <- data.table(pca$x[, 1:2])
embedding[, CarNames := rownames(mtcars)]
ggplot(embedding, aes(x = PC1, y = PC2)) +
    geom_point(size = 10, colour = "steelblue", alpha = 0.3) +
    geom_text(aes(label = CarNames), check_overlap = TRUE) +
    theme_minimal()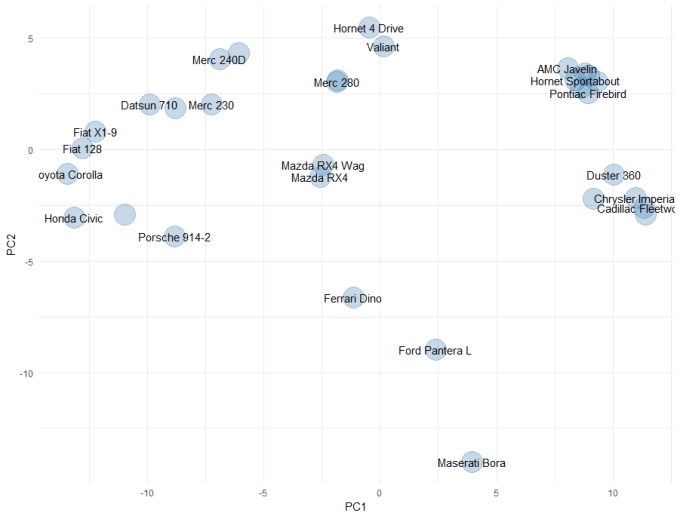
Mahalanobis distance
We're going to begin with the Mahalanobis Distance. This is a statistical measure, not strictly a machine learning method, but it is an extension to simpler univariate tests that we have previously looked at. Recall that typical univariate outlier measures are variance-adjusted distances for example, the calculation for the zscore is:
Where x(i) is an observation (row), mu(x) is the mean of all the rows and sd(x) is the standard deviation. To put this in simple terms, the zscore is a measure of how far from "normal" an observation is, adjusted by the normal amount of variation that we observe (i.e. measure with large spread require an observation to be further from the mean to be outliers, than those with small spread). The Mahalanobis is an extension of the univariate zscore, which also accounts for the correlation structure between all the features (columns):
![]()
Where Sigma(inverse) is the inverse of the covariance matrix of the dataset. Enough formulas, let's see the R code and the results:
library(MVN)
results <- mvOutlier(scale(mtcars), qqplot = TRUE, method = "quan")
results <- data.table(CarNames = rownames(results$outlier), MahalanobisOutlier = results$outlier$Outlier)
embedding <- merge(embedding, results, by = "CarNames")
ggplot(embedding, aes(x = PC1, y = PC2)) +
    geom_point(aes(colour = MahalanobisOutlier == TRUE), size = 10, alpha = 0.3) +
    geom_text(aes(label = CarNames), check_overlap = TRUE) +
    scale_colour_manual(values = c("steelblue", "red")) +
theme_minimal() 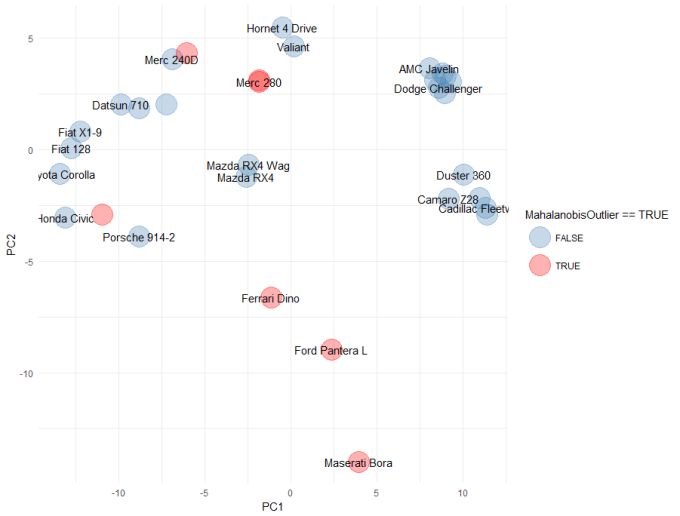
This is really interesting. The Mahalanobis distance confirms out suspicions about the Ferrari Dino, Ford Panetra and Maserati Bora. it also highlights some other cars (some labels missing due to overlap): Merc 280, Merc 280c, Toyota Corona and the Lotus Eurpoa. These cars are an interesting mix of super cars (e.g. Ferrari, Maserati, Lotus) and older cars (e.g. Toyota Corona, Mercs), that clearly bear little resemblance to the other cars in the dataset. Very interesting.
Right, we promised to look at machine learning methods, specifically clustering methods for outlier detection. So let's do that, but we'll keep the results of the Mahalanobis test as our gold standard (because it is based on robust theory, not heuristic algorithms).
DBSCAN
Let's begin with DBSCAN. We don't have the space to fully explain these algorithms here, I encourage you to google DBSCAN and Expectation Maximisation for more details. But to explain DBSCAN simply, it is a density-based clustering algorithm. We need to define two parameters for DBSCAN:
- the neighbourhood (eps): the radius to search around a point
- minPts: the minimum number of neighbouring points necessary to say that an observation is a "core point" and not an outlier (slight simplification, but it will do)
The R code and results are below:
library(dbscan)
embedding[, DClusters := dbscan(scale(mtcars), eps = 2, minPts = 3)$cluster]
ggplot(embedding, aes(x = PC1, y = PC2)) +
    geom_point(aes(colour = factor(DClusters)), size = 10, alpha = 0.3) +
    geom_text(aes(label = CarNames), check_overlap = TRUE) +
    theme_minimal()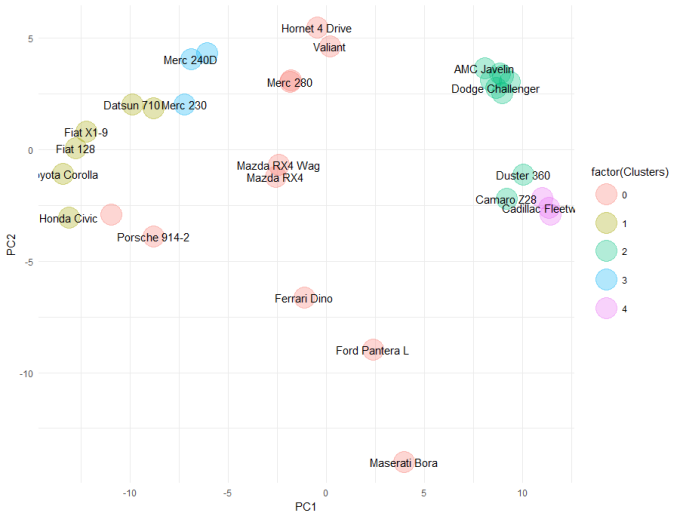
Expectation Maximisation
Like DBSCAN, we won't explain the Expectation maximisation (EM) algorithm here. In fact, it is quite complicated and we couldn't begin to do it justice. Let's simply say that it is an unsupervised clustering algorithm that tries to find "similar subspaces" based on their orientation and variance. Sigh, even that wasn't simple. Never mind, let's see it in action:
library(mclust)
cars_em <- Mclust(scale(mtcars), G = 4)
embedding[, EMClusters := cars_em$classification]
ggplot(embedding, aes(x = PC1, y = PC2)) +
    geom_point(aes(colour = factor(EMClusters)), size = 10, alpha = 0.3) +
    geom_text(aes(label = CarNames), check_overlap = TRUE) +
    theme_minimal()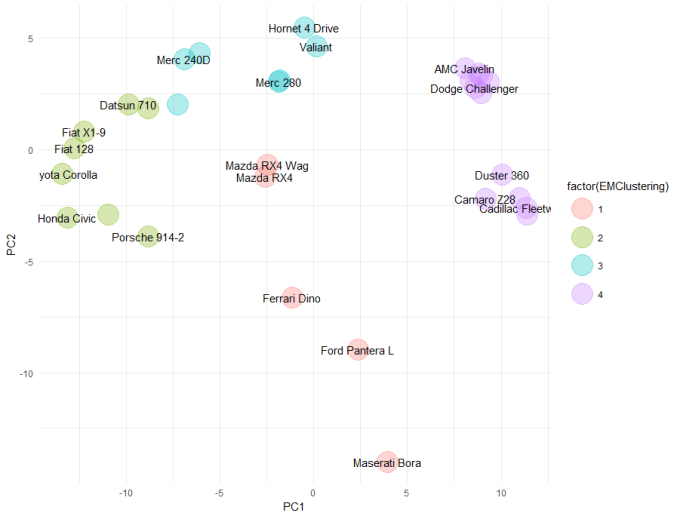
Cluster 1 is the "outlier cluster". Again, the Ferrari, Ford Pantera and Maserati have been found to be outliers. And like DBSCAN, the two Mazda RX4s are outliers. The Toyota Corona and Merc 280s aren't outliers by either DBSCAN or EM. If we compare the clusters identified by EM, with those from DBSCAN, we can see there is very good agreement. In fact, I might prefer EM here, as is has grouped together all of the American / muscle cars into cluster 4.
Wrap up
Overall, there is strong agreement between all three methods that the Ferrari, Ford Pantera and Maserati are outliers in this dataset. Depending on which method you choose, there are other cars which might also be outliers. This is a typical problem with machine learning (or perhaps statistics in general), that your results are reliant on your methods - so you need to understand the assumptions that underpin the methods and you need to be able to weight these against the data you have. In this example, we don't actually have much data (32 cars) - so making a strong case for an algorithm or result set is difficult. In fact, I would be skeptical of the Mahalanobis distance and the EM results simply because there is not a lot of data to estimate variance. If I was being conservative, I would lean towards the results from DBSCAN which relies on fewer assumptions.