

How do you set your alerting thresholds? Do you have a data-driven threshold, a threshold based on past experience, a suggested threshold based on 'best practices', or is it somewhat arbitrary? We've recently asked ourselves this question, and the brutally honest answers leant more towards 'best practices' or arbitrary, for many of our defaults. It seems a little scary at first, but all of our thresholds are set very conservatively to avoid us being exposed.
However, this means we get an extraordinary number of alerts, most of which (~90%) are false alarms. So recently, we have begun to ask slightly different questions: what is normal, and is there sufficient evidence to indicate that the current 'alert' is actually abnormal. In this post, we are going to explore the Outliers package in R to score events and identify outliers. We will begin with a very naive (but robust) approach and use this method as a comparison to the Outliers package.
The Problem and the Data
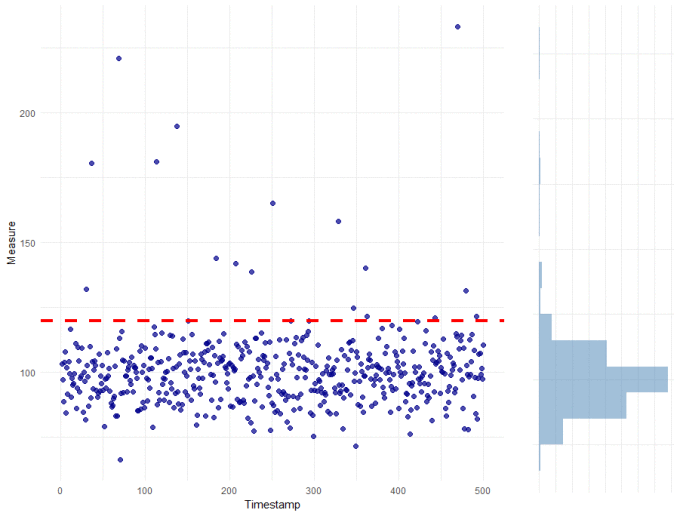
For this problem, we are working with a typical 'monitoring dataset' - that is we have recorded a metric at regular time intervals and we want to fire an alert if the metric exceeds some threshold. The data looks like this:
| Timestamp | Measure |
| 1 | 104 |
| 2 | 98 |
| 3 | 112 |
| ... | ... |
| 500 | 102 |
For this metric, our current threshold is 120 as shown in the plot below:
A basic approach
The nice thing about this data is that it is normally distributed. The measure is continuous (can take on any real value), centred around 100, with a known variance or spread. Each of the observations are independent, which is important. Because we know this (and it really is true in this case), then the most basic thing to do is to measure "how normal" each observation is. Specifically, we are going to measure how far from the mean each observation is and whether this is unlikely, given the spread of the data. For each data point (x), we will calculate the following z-score:
zscore = ( x − μ(xs) ) / sd( xs )
where, μ(xs) is the mean and sd(xs) is the standard deviation of the observations
To determine whether an observation is an outlier or not, we will set the decision threshold at 2, which is approximately equivalent to a critical value of 0.05. Or more simply: if we assume that the data is normally distributed with a constant mean and standard deviation, then a zscore > 2 is highly unlikely to occur any more than 5% of the time. Here it is in R, with the resulting plot:
xs[, zscore := (Measure - mean(Measure)) / sd(Measure)]
main <- ggplot(xs, aes(x = 1:nrow(xs), y = Measure)) +
  geom_point(aes(colour = zscore > 2), alpha = 0.7, size = 2) +
  theme_minimal() + xlab("Timestamp") +
  geom_hline(yintercept = 120, colour = "red", size = 1.5, linetype = "dashed") +
  scale_colour_manual(values = c("darkblue", "red"))
side <- ggplot(xs, aes(x = Measure)) +
  geom_histogram(fill = "steelblue", alpha = 0.5, binwidth = 10) +
  theme_minimal() + coord_flip() + xlab("") + ylab("") + theme(axis.text = element_blank())
grid.arrange(main, side, ncol = 2, widths = c(3, 1)) 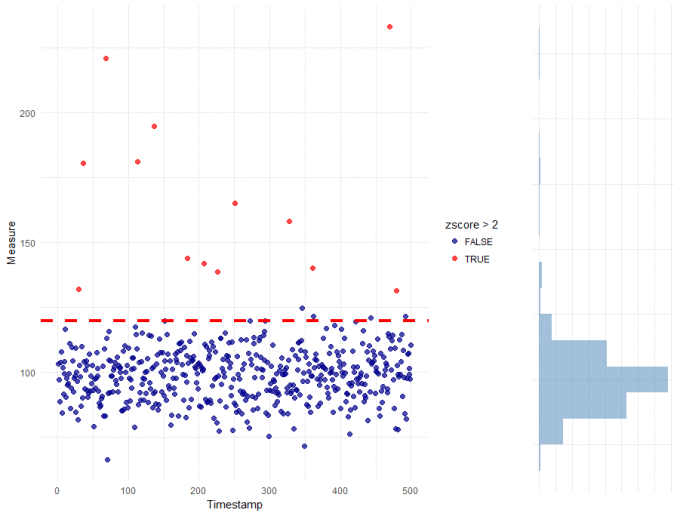
This is a very basic approach, but there is good agreement with our default threshold with potentially less false positives near the threshold. Perhaps more importantly, the zscore-based threshold reflects a desirable property (i.e. alert on observations that are unlikely to occur) rather than some arbitrary limit (anything above 120).
R's Outliers package
R's outlier package is incredibly useful for scoring outliers. The scores() function is a convenient wrapper for a variety of outlier tests. Below, we have plotted the output from 4 tests:
- our test
- a z-score test from the outlier package, which should be the same as out own
- the chisq test from the Outlier package, which is similar to the zscore but it ignores the direction of the deviation by taking the squared difference of the mean and each observation
- and the t-test from the Outlier package, which allows for slightly higher variance about the mean
All of these tests assume that the data is normally distributed, with constant mean and variance. In this case, our data fits these assumptions - though it is fair to say that care should be taken with a lot of real-world datasets.
The R code for this is below, along with the output plots:
library(outliers)
tests <- c("z", "chisq", "t")
results <- rbindlist(lapply(tests,
                            function (t) {
                                data.table(TimeStamp = 1:nrow(xs),
                                           Measure = xs[, Measure],
                                           Score = scores(xs[, Measure], type= t, prob = 0.95),
                                           Method = t)
                            }))
results <- rbind(results, xs[, .(TimeStamp = 1:nrow(xs),
                        Measure,
                        Score = zscore > 2,
                        Method = "custom")])

ggplot(results, aes(x = TimeStamp, y = Measure)) +
  geom_point(aes(colour = Score), alpha = 0.3, size = 2) +
  facet_wrap( ~ Method) +
  theme_minimal() + xlab("Timestamp") +
  geom_hline(yintercept = 120, colour = "red", size = 1.5, linetype = "dashed") +
scale_colour_manual(values = c("darkgrey", "red")) 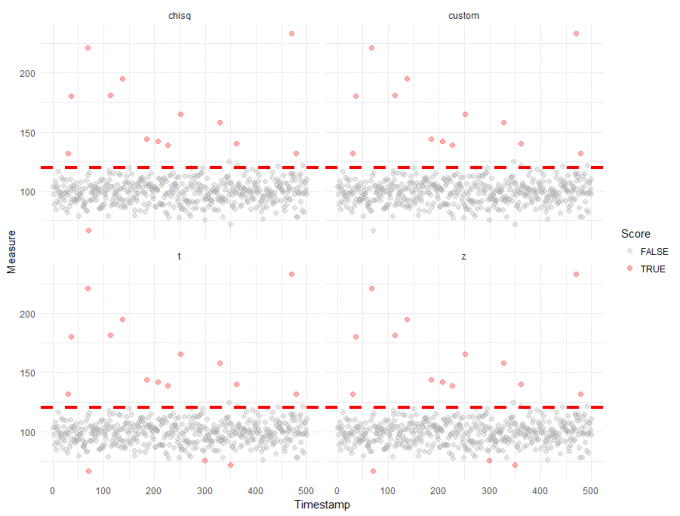
On this dataset, all 4 tests return the same results. The only slight differences are that the Outlier package also identified some outliers which are lower than expected which we had deliberately ignored in our own custom test. Overall though, it is good to see such strong agreement between the tests and helps to build confidence in the results, which appear to be robust across multiple methods.
Wrap up
I mentioned right at the start, that we are on a mission to redefine how we set our alerting thresholds - to use data-driven estimates which accurately reflect each individual client's environments and which also reduce the number of false alerts that we currently receive. Part of the process, which we didn't explicitly cover here, is making sure that we measure "normal behaviour". These "normal" measurements form the basis of any outlier detection. From these measurements, we've shown that it is incredibly simple to score outliers using R. Not only is it easy, we've ensured that our threshold has been set probabilistically, which will help reduce the number of false positives received in the future. The slight caveat here is that the statistical tests used here assume the data is normally distributed, with constant mean and variance. This is not the case with count data or most time-series. However, the ideas here form a solid basis for exploring other types of data, which we might expand on in future posts...