

Introduction
Who should know about the status of the database and what should they know about it?
When I was a practicing C++ software engineer I was an Agile evangelist for many different reasons, but one of the most useful aspects was the daily scrum meetings ensuring that information was shared with everyone. For the record, this was before the process was called Agile. As a database developer I found that the principles of Agile development translated well. However, I am now a DBA it has been my perception that the performance and health information about a database are not so freely available. Please don’t flame me, this is a generalization based on my experience and perception alone.
In my opinion the primary reason for the veil surrounding database performance is based on misinterpretation of the published performance information by application users, programmers, and management. That being said, I fervently believe that, as a DBA, one of my primary responsibilities is to provide performance data to anyone who wants it. I deal with the misinterpretation issue by seizing the opportunity to have a “teachable moment”.
Years ago I created a website template that I still use with every client. The website can be very simple or, given the time and client-interest, may be elaborate. The site may stand-alone on a department server, be installed on the Intranet server, or incorporated on the SharePoint portal in any case its purpose is to provide as much information about the database systems as possible to anyone with an interest, and the appropriate permissions. This approach has served me well many times where the status of the databases, projects, etc. were easily discernable from the site; probably an equal number of times the site has been completely ignored by everyone. So, your mileage may vary, but I’d suggest that at the end of the day you’ll be glad that you shared.
There are benefits to database performance transparency which will be discussed in the following section. Then, I’ll share a script that I use that helps me automate the collection and dissemination of the database performance information.
Database Performance Transparency
A database is only as good as the user perceives it to be. When poor performance is perceived users may lose confidence in the database and subsequently may begin to lose confidence in the DBA. Therefore, I suggest that there are three (3) primary reasons to publish database performance status to users; they are:
- User confidence
- User perception
- User education
Ancillary reasons include getting in front of a problem and reducing DBA stress. (Rachitsky, Benefits of Transparency, 2010)
Benefits
I want my client to trust me as a DBA; there is a level of implicit trust when the client provides me with system administration permissions on their instance. However, the trust the client presumes does not necessarily translate into trust or confidence in my DBA abilities; I must earn that confidence. To earn the client’s confidence I ensure that the good, the bad, and even the ugly are clearly communicated. As mentioned above, I generally communicate the status of the database in tabular, graphical, and / or narrative form on a website this provides both a present and future reference. When an issue arises an explanation along with a link to the website’s collected data demonstrates openness and thereby instills confidence.
Additionally, the user’s perception may be effected by readily providing information related to the database system’s performance. The natural presumption by an application user experiencing delays is that the database is at fault sometimes this is correct but at other times the delays could be the result of a myriad of other causes. Providing easily accessible and understandable performance metrics to the user will demonstrate the database system’s stability and responsiveness helping to revise the user’s perception.
We are all teachers. As DBAs we teach others to write more efficient SQL, design a better table, etc. in order to help them be more self-sufficient and reduce our workload. This same principle can be applied to the end users who, in general, have little understanding of key database performance metrics. By proactively publishing performance metrics we provide the user a view that we may now explain either one-to-one or via concise easily understood narratives. One of the most memorable retail taglines I’ve ever read is, “An educated consumer is our best customer.” I feel similarly, an educated user is my best client.
Performance Metrics Collection
The collection of performance metrics may be accomplished using a number of approaches. My papers, Performance Monitoring with Dynamic Management Views and SQL Server Instance Health Monitoring Tool, describe a method for performance metrics collection and representation using DMVs, SSIS, and SSRS. The assumption in the approach discussed in the referenced papers is that the collection system can connect to all instances. Sometimes there circumstances when this is not feasible; therefore, another approach is necessary.
Currently, I have disparate clients whose instances I monitor via individual distinct connection methods; e.g. VPN, RDP, etc. For these clients I needed to collect performance metrics and make them available for viewing so I developed the script presented below. Keep in mind that this is a first-cut driven by a very short timeline that will evolve in the next iteration to send the raw data to a consolidation database from where it will be published.
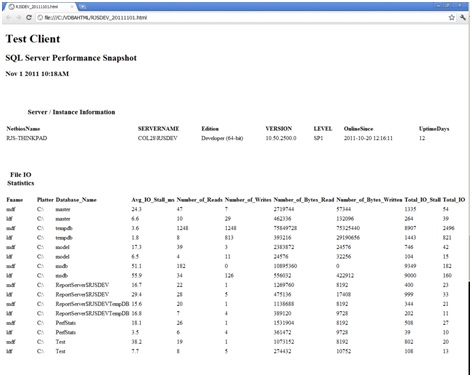
Although the included script only collects two metrics the design pattern can be easily replicated for the colleciton of any number of metrics; i.e. the current version on my monitored instances collect about a dozen metrics. The output of the script is a file in HTML format ready to load into a browser by necessity the generation of the HTML file requires the use of xp_cmdshell so ensure that it is enabled. I generate the HTML file on all of my monitored instances then email the file to another server where the email is processed placing the HTML file in a specified folder from where it is linked to a WWW site.
Here’s a sample of the HTML output:
SQL Server Performance Snapshot Script
I've included a portion of the script I use to generate the snapshot to serve as a design pattern for customization. My production script collects 21 metrics that I beleive are useful for performance monitoring. I like to run the script in a job generating a fresh HTML-based performance snapshot every day with an automated process using email, scp, etc. and a custom Windows Service to get the file to the WWW server for publishing.
IF OBJECT_ID('tempdb..#TEMPhtml2') IS NOT NULL
BEGIN
   DROP TABLE #TEMPhtml2
END
CREATE TABLE #TEMPhtml2
(
       [columns] VARCHAR (MAX)
)
DECLARE @finalhtmlout VARCHAR(MAX)
DECLARE @columns VARCHAR(8000)
DECLARE @colHeader VARCHAR(8000)
DECLARE @Final VARCHAR(8000)
DECLARE @clientName VARCHAR(50)
DECLARE @instanceName VARCHAR(50)
DECLARE @col VARCHAR(MAX)
/******************************************************************************************//*  DEBUG OUTPUT CONTROL    */DECLARE @DEBUG SMALLINT = 0  --> 0 == OFF  1 == VERBOSE   2 == FINAL HTML ONLY
/******************************************************************************************//******************************************************************************************//* CLIENT NAME    */SET @clientName = 'Test Client'
/******************************************************************************************/SET @instanceName = CONVERT (VARCHAR,SERVERPROPERTY ('ComputerNamePhysicalNetBIOS')) + '\' + CONVERT(VARCHAR,SERVERPROPERTY('InstanceName'))
--initialize HTML page
SET @finalhtmlout = ' <!DOCTYPE html PUBLIC "-//W3C//DTD XHTML 1.0 Transitional//EN"  "http://www.w3.org/TR/xhtml1/DTD/xhtml1-transitional.dtd">
<html xmlns="http://www.w3.org/1999/xhtml" xml:lang="en" lang="en"> <body> '
SET @finalhtmlout = @finalhtmlout + '<h1>' + @clientName + '</h1>' + '<h2>SQL Server Performance Snapshot</h2>'
SET @finalhtmlout = @finalhtmlout + '<h3>'+ CONVERT(VARCHAR,GETDATE(),100) + '</h3><br />'
/*********************************************************************************************/--get General Info
--dump contents of the temp table
TRUNCATE TABLE #TEMPhtml2
--drop the temp table for this data if it already exists
IF OBJECT_ID('tempdb..#DBA_GenInfo') IS NOT NULL
BEGIN
   DROP TABLE #DBA_GenInfo
END
--create the temp table for this data
CREATE TABLE #DBA_GenInfo
(
NetbiosName VARCHAR(50),
SERVERNAME VARCHAR(50),
Edition VARCHAR(50),
[VERSION] VARCHAR(50),
[LEVEL] VARCHAR(50),
OnlineSince VARCHAR(50),
UptimeDays VARCHAR(9)
)
--declare any variables needed for data collection
DECLARE @vDate_Now AS DATETIME
DECLARE @vOnline_Since AS VARCHAR (19)
DECLARE @vUptime_Days AS INT
DECLARE @vDate_24_Hours_Ago AS DATETIME
--insert the data into the temp table defined above
SELECT
        @vOnline_Since = CONVERT (NVARCHAR (19), DB.create_date, 120)
       ,@vUptime_Days = DATEDIFF (DAY, DB.create_date, GETDATE ())
FROM
       [master].[sys].[databases] DB
WHERE
       DB.name = 'Perfstats' --this is a database that was installed at the same time as the instance
SET @vDate_24_Hours_Ago = GETDATE ()-1
SET @vDate_Now = @vDate_24_Hours_Ago+1
INSERT INTO #DBA_GenInfo
SELECT
        CONVERT (VARCHAR,SERVERPROPERTY ('ComputerNamePhysicalNetBIOS'))
       ,CONVERT (VARCHAR,@@SERVERNAME)
       ,REPLACE (CONVERT (VARCHAR, SERVERPROPERTY ('Edition')),' Edition','')
       ,CONVERT (VARCHAR,SERVERPROPERTY ('ProductVersion'))
       ,CONVERT (VARCHAR,SERVERPROPERTY ('ProductLevel'))
       ,CONVERT (VARCHAR,@vOnline_Since)
       ,CONVERT (VARCHAR,REVERSE (SUBSTRING (REVERSE (CONVERT (VARCHAR (15), CONVERT (MONEY, @vUptime_Days), 1)), 4, 15)))
IF @DEBUG = 1
BEGIN
       SELECT * FROM #DBA_GenInfo
END
--get the column names and store them in @columns
SELECT @columns = COALESCE(@columns + ' + '' </td><td> '' + ', '') +
                             'convert(varchar(100),isnull(' + c.name +','' ''))'
FROM tempdb.sys.columns c
INNER JOIN tempdb.sys.tables t ON c.object_id = t.object_id
WHERE t.name LIKE '#DBA_GenInfo%'
IF @DEBUG = 1
BEGIN
       SELECT @columns AS [columns]
END
--Setup the html column header
SET @colHeader = '<tr bgcolor=#EDFEDF align=center> <TR><TH><H3><BR>Server / Instance Information</H3></TH></TR>'
SELECT @colHeader = @colHeader + '<td><b> ' + c.name + '</b></td>'
FROM tempdb.sys.columns c
INNER JOIN tempdb.sys.tables t ON c.object_id = t.object_id
WHERE t.name LIKE '#DBA_GenInfo%'
SET @colHeader=@colHeader + '</tr>'
IF @DEBUG = 1
BEGIN
       SELECT @colHeader AS [columnHeader]
END
--get the data selection and insertion statements ready
SET @Final = 'insert into #TEMPhtml2 Select ''<tr><td>'' + ' + @columns + '+ ''</td></tr> '' from #DBA_GenInfo '
IF @DEBUG = 1
BEGIN
       SELECT @final AS FINAL
END
--execute the select
EXECUTE( @Final )
IF @DEBUG = 1
BEGIN
       SELECT @colHeader AS COLHEADER
       SELECT * FROM #TEMPhtml2 AS TEMPHTML2
END
--initialize the HTML table
SET @finalhtmlout = @finalhtmlout + ' <style type="text/css" media="all">  table { margin-bottom: 2em; border-collapse: collapse } td,th {border= 1 solid #999; padding: 0.2em 0.2em; font-size: 12;} </style> <table width="100%"> ' + @colHeader
IF @DEBUG = 1
BEGIN
       SELECT @finalhtmlout AS HTMLoutput1
END
-- insert values for retrieved metric in HTML format
SET @col = NULL
DECLARE HTML_Cur CURSOR
FOR SELECT [columns] FROM #TEMPhtml2
OPEN HTML_Cur
FETCH NEXT FROM HTML_Cur
INTO @col
WHILE @@FETCH_STATUS = 0
BEGIN
       SET @finalhtmlout= @finalhtmlout + @col + '</td></tr>'
       FETCH NEXT FROM HTML_Cur
       INTO @col
END
CLOSE HTML_Cur
DEALLOCATE HTML_Cur
-- clean up locals
DROP TABLE #DBA_GenInfo
SET @columns = NULL
SET @colHeader = NULL
SET @Final = NULL
/***********************************************************************************************/-- get io stats
--dump contents of the temp table
TRUNCATE TABLE #TEMPhtml2
IF OBJECT_ID('tempdb..#DBA_PLEStats') IS NOT NULL
BEGIN
   DROP TABLE #DBA_IOStats
END
--get IO stats and generate HTML for data
CREATE TABLE #DBA_IOStats
(
[Fname] VARCHAR(25),
[Platter] VARCHAR(5),
[Database_Name] VARCHAR(75),
[Avg_IO_Stall_ms] VARCHAR(15),
[Number_of_Reads] VARCHAR(15),
[Number_of_Writes] VARCHAR(15),
[Number_of_Bytes_Read] VARCHAR(15),
[Number_of_Bytes_Written] VARCHAR(15),
[Total_IO_Stall] VARCHAR(15),
[Total_IO] VARCHAR(15)
)

DECLARE @TotalIO BIGINT ,
    @TotalBytes BIGINT ,
    @TotalStall BIGINT

SELECT  @TotalIO = SUM(num_of_reads + num_of_writes) ,
        @TotalBytes = SUM(num_of_bytes_read + num_of_bytes_written) ,
        @TotalStall = SUM(io_stall)
FROM    sys.dm_io_virtual_file_stats(-1, -1)
INSERT INTO #DBA_IOStats ([Fname],[Platter],[Database_Name],[Avg_IO_Stall_ms],[Number_of_Reads],
[Number_of_Writes],[Number_of_Bytes_Read],[Number_of_Bytes_Written],[Total_IO_Stall],[Total_IO])
SELECT  LOWER(SUBSTRING(physical_name, LEN(physical_name) - 2, 4)) ,
        UPPER(SUBSTRING(physical_name, 1, 3))  ,
        [DbName] = DB_NAME([f].[database_id]) ,
        CAST(( io_stall_read_ms + io_stall_write_ms ) / ( 1.0 + num_of_reads
                                                          + num_of_writes ) AS NUMERIC(10,
                                                              1)) ,
        [num_of_reads] ,
        [num_of_writes] ,
        [num_of_bytes_read] ,
        [num_of_bytes_written] ,
        [io_stall] ,
        [TotalIO] = ( num_of_reads + num_of_writes )
        FROM    sys.dm_io_virtual_file_stats(-1, -1) [IO]
        INNER JOIN sys.master_files f ON [IO].database_id = f.database_id
                                         AND [IO].[file_id] = f.[file_id]
IF @DEBUG = 1
BEGIN
       SELECT * FROM #DBA_IOStats
END
------Prepare column statement
SELECT @columns = COALESCE(@columns + ' + '' </td><td> '' + ', '') +
                             'convert(varchar(100),isnull(' + c.name +','' ''))'
FROM tempdb.sys.columns c
INNER JOIN tempdb.sys.tables t ON c.object_id = t.object_id
WHERE t.name LIKE '#DBA_IOStats%'
IF @DEBUG = 1
BEGIN
       SELECT @columns AS [columns]
END
----Prepare column Header
SET @colHeader = '<tr bgcolor=#EDFEDF align=center> <TR><TH><H3><BR>File IO Statistics</H3></TH></TR>'
SELECT @colHeader = @colHeader + '<td><b> ' + c.name + '</b></td>'
FROM tempdb.sys.columns c
INNER JOIN tempdb.sys.tables t ON c.object_id = t.object_id
WHERE t.name LIKE '#DBA_IOStats%'
SET @colHeader=@colHeader + '</tr>'
IF @DEBUG = 1
BEGIN
       SELECT @colHeader AS [columnHeader]
END
------prepare final output
SET @Final = 'insert into #TEMPhtml2 Select ''<tr><td>'' + ' + @columns + '+ ''</td></tr> '' from #DBA_IOStats '
IF @DEBUG = 1
BEGIN
       SELECT @final AS FINAL
END
EXECUTE( @Final )
IF @DEBUG = 1
BEGIN
       SELECT @colHeader AS COLHEADER
       SELECT * FROM #TEMPhtml2 AS TEMPHTML2
END
--initialize table
SET @finalhtmlout = @finalhtmlout + ' <style type="text/css" media="all">  table { margin-bottom: 2em; border-collapse: collapse } td,th {border= 1 solid #999; padding: 0.2em 0.2em; font-size: 12;} </style> <table width="100%"> ' + @colHeader
IF @DEBUG = 1
BEGIN
       SELECT @finalhtmlout AS HTMLoutput1
END
-- insert values for retrieved metric in HTML format
SET @col=NULL
DECLARE HTML_Cur CURSOR
FOR SELECT [columns] FROM #TEMPhtml2
OPEN HTML_Cur
FETCH NEXT FROM HTML_Cur
INTO @col
WHILE @@FETCH_STATUS = 0
BEGIN
       SET @finalhtmlout= @finalhtmlout + @col + '</td></tr>'
       FETCH NEXT FROM HTML_Cur
       INTO @col
END
CLOSE HTML_Cur
DEALLOCATE HTML_Cur
-- clean up locals
DROP TABLE #DBA_IOStats
SET @columns = NULL
SET @colHeader = NULL
SET @Final = NULL
/**********************************************************************************************/-- closes the HTML file
SET @finalhtmlout= @finalhtmlout + ' </table></body></htmL>'
IF OBJECT_ID('tempdb..##tempOut') IS NOT NULL
BEGIN
   DROP TABLE ##tempOut
END
CREATE TABLE ##tempOut
(
       html VARCHAR(MAX)
)
INSERT INTO ##tempOut
SELECT @finalhtmlout
-- write html file to disk
DECLARE @filename VARCHAR(75)
/******************************************************************************************//*  File Name    */SET @filename = 'c:\dbahtml\'
/******************************************************************************************/SET @filename = @filename + CONVERT(VARCHAR,SERVERPROPERTY('InstanceName')) + '_' + CONVERT(VARCHAR,GETDATE(),112) + '.html'
DECLARE @string AS NVARCHAR(4000)
SELECT    @string = 'bcp ##tempOut  out ' + @filename + ' -T -c -S  ' + @instanceName
EXEC master.dbo.xp_cmdshell @string , no_output
IF @DEBUG >= 1
BEGIN
       SELECT @string AS [BCP command]
       SELECT @filename AS [FileName]
       SELECT @finalhtmlout AS [Final HTML OUTPUT]
END
DROP TABLE ##tempOut
Summary
Not very sophisticated, but as a subscriber to the K.I.S.S. principle I find this script and the supporting process very useful. I get performance metrics in front of the client via my DBA website without excessive infrastructure or development effort.
References
Rachitsky, L. (2010, July 1). Benefits of Transparency. Retrieved 10 31, 2011, from Transparent Uptime: The drive for transparency in the uptime and performance of online services.: http://www.transparentuptime.com/2010/07/benefits-of-transparency.html