

If you've spent much time using SQL Profiler you know that it's an incredibly
useful tool, but can be incredibly frustrating as well. One such instance is
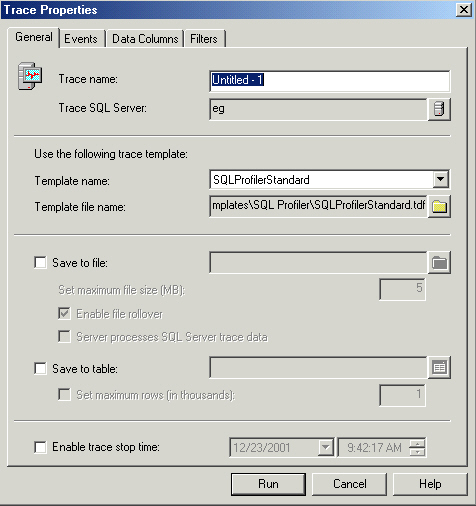
when you set up a trace to log the results to a table and then save it as a
script to use later - it doesn't work! If you're not familiar with this part of
Profiler, here is where you enable the save to table option:
This works fine in Profiler. If you use this method, it's a good idea to log
to a separate server (or even a workstation running Personal edition) so that
the overhead of logging doesn't affect whatever process you're working on.
When you use the File | Script Trace menu selection, this is what you get -
notice the section I've highlighted in blue:
/****************************************************/
/* Created by: SQL Profiler */
/* Date: 12/23/2001 08:38:51 AM */
/****************************************************/
-- Create a Queue
declare @rc int
declare @TraceID int
declare @maxfilesize bigint
set @maxfilesize = 5
-- Please replace the text InsertFileNameHere, with an appropriate
-- filename prefixed by a path, e.g., c:\MyFolder\MyTrace. The .trc extension
-- will be appended to the filename automatically. If you are writing from
-- remote server to local drive, please use UNC path and make sure server has
-- write access to your network share
exec @rc = sp_trace_create @TraceID output, 0, N'InsertFileNameHere', @maxfilesize, NULL
if (@rc != 0) goto error
-- Client side File and Table cannot be scripted
-- Set the events
declare @on bit
set @on = 1
exec sp_trace_setevent @TraceID, 10, 1, @on
exec sp_trace_setevent @TraceID, 10, 6, @on
exec sp_trace_setevent @TraceID, 10, 9, @on
exec sp_trace_setevent @TraceID, 10, 10, @on
exec sp_trace_setevent @TraceID, 10, 11, @on
exec sp_trace_setevent @TraceID, 10, 12, @on
exec sp_trace_setevent @TraceID, 10, 13, @on
exec sp_trace_setevent @TraceID, 10, 14, @on
exec sp_trace_setevent @TraceID, 10, 16, @on
exec sp_trace_setevent @TraceID, 10, 17, @on
exec sp_trace_setevent @TraceID, 10, 18, @on
exec sp_trace_setevent @TraceID, 12, 1, @on
exec sp_trace_setevent @TraceID, 12, 6, @on
exec sp_trace_setevent @TraceID, 12, 9, @on
exec sp_trace_setevent @TraceID, 12, 10, @on
exec sp_trace_setevent @TraceID, 12, 11, @on
exec sp_trace_setevent @TraceID, 12, 12, @on
exec sp_trace_setevent @TraceID, 12, 13, @on
exec sp_trace_setevent @TraceID, 12, 14, @on
exec sp_trace_setevent @TraceID, 12, 16, @on
exec sp_trace_setevent @TraceID, 12, 17, @on
exec sp_trace_setevent @TraceID, 12, 18, @on
exec sp_trace_setevent @TraceID, 14, 1, @on
exec sp_trace_setevent @TraceID, 14, 6, @on
exec sp_trace_setevent @TraceID, 14, 9, @on
exec sp_trace_setevent @TraceID, 14, 10, @on
exec sp_trace_setevent @TraceID, 14, 11, @on
exec sp_trace_setevent @TraceID, 14, 12, @on
exec sp_trace_setevent @TraceID, 14, 13, @on
exec sp_trace_setevent @TraceID, 14, 14, @on
exec sp_trace_setevent @TraceID, 14, 16, @on
exec sp_trace_setevent @TraceID, 14, 17, @on
exec sp_trace_setevent @TraceID, 14, 18, @on
exec sp_trace_setevent @TraceID, 15, 1, @on
exec sp_trace_setevent @TraceID, 15, 6, @on
exec sp_trace_setevent @TraceID, 15, 9, @on
exec sp_trace_setevent @TraceID, 15, 10, @on
exec sp_trace_setevent @TraceID, 15, 11, @on
exec sp_trace_setevent @TraceID, 15, 12, @on
exec sp_trace_setevent @TraceID, 15, 13, @on
exec sp_trace_setevent @TraceID, 15, 14, @on
exec sp_trace_setevent @TraceID, 15, 16, @on
exec sp_trace_setevent @TraceID, 15, 17, @on
exec sp_trace_setevent @TraceID, 15, 18, @on
exec sp_trace_setevent @TraceID, 17, 1, @on
exec sp_trace_setevent @TraceID, 17, 6, @on
exec sp_trace_setevent @TraceID, 17, 9, @on
exec sp_trace_setevent @TraceID, 17, 10, @on
exec sp_trace_setevent @TraceID, 17, 11, @on
exec sp_trace_setevent @TraceID, 17, 12, @on
exec sp_trace_setevent @TraceID, 17, 13, @on
exec sp_trace_setevent @TraceID, 17, 14, @on
exec sp_trace_setevent @TraceID, 17, 16, @on
exec sp_trace_setevent @TraceID, 17, 17, @on
exec sp_trace_setevent @TraceID, 17, 18, @on
-- Set the Filters
declare @intfilter int
declare @bigintfilter bigint
exec sp_trace_setfilter @TraceID, 10, 0, 7, N'SQL Profiler'
-- Set the trace status to start
exec sp_trace_setstatus @TraceID, 1
-- display trace id for future references
select TraceID=@TraceID
goto finish
error:
select ErrorCode=@rc
finish:
go
Is that weird or what? It turns out you can only log the results to a table
from Profiler. If you want to run the profile as a script your only choice is to
log to a file and import afterwards into a table using the system function
fn_trace_gettable, like this:
SELECT * INTO temp_trc FROM ::fn_trace_gettable(c:\my_trace.trc",
default).
Wouldn't you think if Profiler could do it there would be a way for you to do
it without Profiler? Being curious, I decided to profile Profiler to see what
was going on under the hood. To do this, I just removed the 'SQL Profiler'
application name filter and ran a standard trace, then started another instance
of Profiler making no changes to the filter. I then connected using Query
Analyzer and ran a simple select count query. Here are the highlights of what I
captured:
CREATE TABLE [TraceTest] ([RowNumber] int identity PRIMARY KEY,[EventClass] int NULL,[TextData] ntext NULL,[NTUserName] nvarchar(128) NULL,[ClientProcessID] int NULL,[ApplicationName] nvarchar(128) NULL,[LoginName] nvarchar(128) NULL,[SPID] int NULL,[Duration] bigint NULL,[StartTime] datetime NULL,[Reads] bigint NULL,[Writes] bigint NULL,[CPU] int NULL)
select count(*) from sysobjects
exec sp_executesql N'INSERT INTO [TraceTest] ([EventClass],[TextData],[NTUserName],[ClientProcessID],[ApplicationName],[LoginName],[SPID],[Duration],[StartTime],[Reads],[Writes],[CPU]) VALUES ( @P1,@P2,@P3,@P4,@P5,@P6,@P7,@P8,@P9,@P10,@P11,@P12)', N'@P1 decimal(10,0),@P2 ntext,@P3 nvarchar(8),@P4 int,@P5 nvarchar(36),@P6 nvarchar(14),@P7 int,@P8 bigint,@P9 datetime,@P10 bigint,@P11 bigint,@P12 int', 12, N'select count(*) from sysobjects
', N'Andy', 2176, N'SQL Query Analyzer', N'EG\Andy', 54, 0, 'Dec 23 2001 8:37AM'
I know that's not the easiest thing to read. Basically Profiler is creating
the table 'TraceTest' for us, then just generating an insert statement each time
it receives a profile event - in this case the 'select count(*) from sysobjects'
I executed in Query Analyzer. This means that as far as I can tell, the ability
to log to a table is part of Profiler and not a built in ability of SQL itself,
a conclusion supported by the comments in the script that says 'client side
table cannot be scripted'!
Does that mean there is NO way to run a trace on the server and have it log
directly to a table? No easy way, that's for sure. I can think of two
possibilities. One is to capture events the same way Profiler does and
essentially replicate it's behavior of creating the table and inserting events
as received. I don't see a Profiler COM object, so doing this may require lower
level programming than I know how to do! The other would be to automate Profiler
to get it to do the work for us, either using it's ability to load a template
using a command line switch (doesn't seem to preserve the log to table settings)
or by sending keystrokes to simulate a user setting up the profile (a bad
hack!).
Logging to a file and then importing later is not a terrible thing, at least
they provided the function to do most of the work for us. You have to use
sp_trace_setstatus to stop the trace first, then you can load it into a table.
So readers, anyone have a better idea? Post your comments in the attached
discussion forum and maybe we'll find a better way to do this!