

Objectives
Use PERFMON/PAL and the sys.dm_os_waitsstats DMV to identify the cause of the latency in a Transaction Replication topology involving a publisher and two continously updating pull subscribers, one on under resourced hardware. This will show how and why an under resourced subscriber suffers under heavy load in a Transaction Replication topology.
Test Summary
The LAB 1 diagram below shows the replication topology used.
- Instance XML400DB1 is the publisher
- Instance XML400DB1/I2 is a well resourced subscriber on the same server as the publisher
- Instance XML400DB2 is an under resourced subscriber on a different server.
To prepare the environment and clear all caches, all four instances were restarted at the start of each test cycle.

The 1st test cycle:
- 18:10 - Start PERFMON monitoring instances under no load
- 18:15 - Start SQLStress utility
- 18:20 - Stop SQL Stress utility
- 18:25 - Stop PERFMON
A default baseline set of PERFMON counters were used, suggestions in books referenced at the end of this article.
The Start/End State of Replication under no load is shown below. The Replication Monitor is shown with PERFMON in the background indicating 'Writes per/sec' on the Publisher, IE The simulated transaction load.

The image below is again the Replication Monitor with PERFMON in the background and now the SQLStress utility too. The load test has started, XML400DB2 initially performs reasonably well ('Good' according to the monitor) subscribing to a SQLStress load simulation database on XML400DB1.

Gradually, latency starts to creep up on XML400DB2 (under resourced), the monitor shows 'Critical' performance issues. XML400DB1 also starts suffering but not to the same extent, the monitor now showing 'Good'.

Stopping the SQLStress load simulation on XML400DB1 gives both substribers a chance to apply all outstanding transactions.
Finally all transactions are applied to all subscribers and replication latency returns to a condition where performance is deemed 'excellent' by the monitor as at the start of the test,IE at rest.
XML400DB2 (Distressed subscriber) PERFMON/PAL Results
The PERFMON counters collected for the under resourced subscriber were fed into the Performance Analysis Log utility, against 'Threshold File Type' SQLServer.xml, which raised the following alerts.
The PAL tool (reference links at end) compares the counters collected against thresh-holds and raises alerts when they are breached.
Below are the results for the under resourced subscriber, 'Alerts' have been underlined.
- Memory
- Memory Available MBytes (Alerts: 1)
- Memory Free System Page Table Entries (Alerts: 0)
- Memory Pages/sec (Alerts: 0)
- MSSQL$I2:Buffer Manager
- Buffer cache hit ratio (Stats only)
- Lazy writes/sec (Stats only)
- Page life expectancy (Stats only)
- MSSQL$I2:General Statistics
- Processes blocked (Stats only)
- MSSQL$I2:Locks
- Lock Waits/sec (Stats only)
- Lock Timeouts/sec (Stats only)
- MSSQL$I2:SQL Statistics
- Batch Requests/sec (Stats only)
- SQL Re-Compilations/sec (Stats only)
- SQL Compilations/sec (Stats only)
- MSSQL$I2:Transactions
- Free Space in tempdb (KB) (Stats only)
- Paging File
- Paging File % Usage (Alerts: 0)
- % Usage Peak (Stats only)
- Process
- % Processor Time (Stats only)
- % Privileged Time (Stats only)
- Processor
- Processor % Processor Time (Alerts: 7)
- Processor % Privileged Time (Alerts: 6)
- SQLServer:Buffer Manager
- SQLServer:Buffer Manager Page life expectancy (Alerts: 18)
- SQLServer:General Statistics
- Processes blocked (Stats only)
- SQLServer:Locks
- SQLServer:Locks Lock Waits/sec (Stats only)
- SQLServer:Locks Lock Timeouts/sec (Stats only)
- SQLServer:SQL Statistics
- SQLServer:SQL Statistics Batch Requests/sec (Alerts: 1)
- SQLServer:SQL Statistics SQL Compilations/sec (Alerts: 43)
- SQLServer:SQL Statistics SQL Re-Compilations/sec (Alerts: 2)
- SQLServer:Transactions
- Free Space in tempdb (KB) (Stats only)
The SQLStress utility generates adhoc SQL statements which cause recompilation so it's not worth spending too long looking into these.
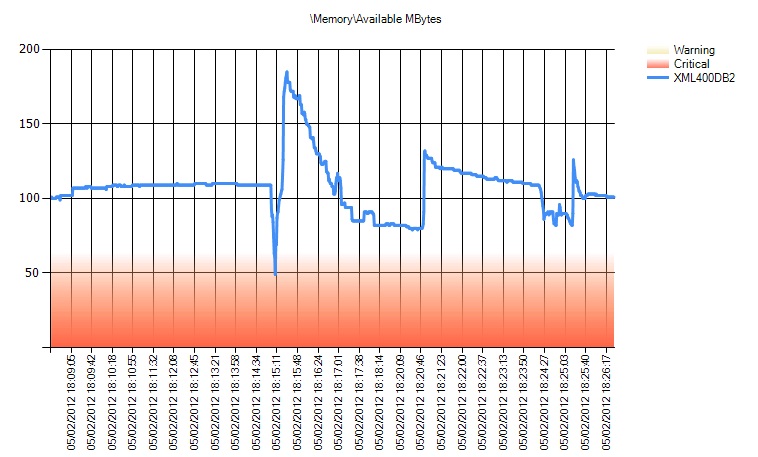
The Page Life Expectancy alerts indicate memory pressure. The PAL generated diagram below for 'Memory\Available MBytes' shows volatility some of which might be related to HyperV and the test lab environment.
Stopping the SQLStress load simulation on XML400DB1 gives both substribers a chance to apply all outstanding transactions.
Finally all transactions are applied to all subscribers and replication latency returns to a condition where performance is deemed 'excellent' by the monitor as at the start of the test,IE at rest.
XML400DB2 (Distressed subscriber) PERFMON/PAL Results
The PERFMON counters collected for the under resourced subscriber were fed into the Performance Analysis Log utility, against 'Threshold File Type' SQLServer.xml, which raised the following alerts.
The PAL tool (reference links at end) compares the counters collected against thresh-holds and raises alerts when they are breached.
Below are the results for the under resourced subscriber, 'Alerts' have been underlined.
- Memory
- Memory Available MBytes (Alerts: 1)
- Memory Free System Page Table Entries (Alerts: 0)
- Memory Pages/sec (Alerts: 0)
- MSSQL$I2:Buffer Manager
- Buffer cache hit ratio (Stats only)
- Lazy writes/sec (Stats only)
- Page life expectancy (Stats only)
- MSSQL$I2:General Statistics
- Processes blocked (Stats only)
- MSSQL$I2:Locks
- Lock Waits/sec (Stats only)
- Lock Timeouts/sec (Stats only)
- MSSQL$I2:SQL Statistics
- Batch Requests/sec (Stats only)
- SQL Re-Compilations/sec (Stats only)
- SQL Compilations/sec (Stats only)
- MSSQL$I2:Transactions
- Free Space in tempdb (KB) (Stats only)
- Paging File
- Paging File % Usage (Alerts: 0)
- % Usage Peak (Stats only)
- Process
- % Processor Time (Stats only)
- % Privileged Time (Stats only)
- Processor
- Processor % Processor Time (Alerts: 7)
- Processor % Privileged Time (Alerts: 6)
- SQLServer:Buffer Manager
- SQLServer:Buffer Manager Page life expectancy (Alerts: 18)
- SQLServer:General Statistics
- Processes blocked (Stats only)
- SQLServer:Locks
- SQLServer:Locks Lock Waits/sec (Stats only)
- SQLServer:Locks Lock Timeouts/sec (Stats only)
- SQLServer:SQL Statistics
- SQLServer:SQL Statistics Batch Requests/sec (Alerts: 1)
- SQLServer:SQL Statistics SQL Compilations/sec (Alerts: 43)
- SQLServer:SQL Statistics SQL Re-Compilations/sec (Alerts: 2)
- SQLServer:Transactions
- Free Space in tempdb (KB) (Stats only)
The SQLStress utility generates adhoc SQL statements which cause recompilation so it's not worth spending too long looking into these.
The Page Life Expectancy alerts indicate memory pressure. The PAL generated diagram below for 'Memory\Available MBytes' shows volatility some of which might be related to HyperV and the test lab environment.

Paging is CPU intensive and the 'Memory pages/sec' spikes above correlate to the 100% 'Processor\%Processor Times' spikes below.

To confirm the results and hypothetical 'memory pressure' conclusion from the first round of testing using PAL, a second test cycle was executed in the same environment to the following schedule:
- 20:30 - Start collecting and saving sys.dm_os_waitstats once every 10 seconds
- 20:35 - Start SQLStress load simulation
- 20:40 - Stop SQLStress load simulation
- 20:45 - Stop collecting sys.dm_os_waitstats
Here, sys.dm_oswaitstats were gathered from the under resourced subscriber once every 10 seconds as the load simulation ran.
The wait stats results were loaded into an Excel spreadsheet and scanned visually looking for esculating wait values for all types. Christian Boltons SQL Server 2008 Internals books has a nice list of which wait types can be ignored.
The wait types shown below were the clearest esculating values and indicate Disk Subsystem IO pressure on the under resourced subscriber. It was failing to keep up with load generated by SQLStress.
Wait Type Description - PAGEIOLATCH waits occur when a task is waiting on a latch for a buffer that is in an I/O request.
The latch request is in Exclusive mode. Long waits may indicate problems with the disk subsystem.

Wait Type Description - PAGEIOLATCH_SH waits occur when a task is waiting on a latch for a buffer that is in an I/O request.
The latch request is in Shared mode. Long waits may indicate problems with the disk subsystem.

Wait Type Description - PAGEIOLATCH_UP waits occur when a task is waiting on a latch for a buffer that is in an I/O request.
The latch request is in Update mode. Long waits may indicate problems with the disk subsystem

Conclusion
Test 1 analysis using PAL indicated that Memory Pressure was responsible for the increasing latency in the under resourced subscriber. The PAL tool ignored the 'PhysicalDisk/Avg.Disk sec/Read&Write' counters which were collected.
Test 2 indicated the disk subsystem was failing to keep up with the load simulation on the under resourced subscriber. Dirty pages filled the buffer pool and the system started paging excessively as memory pressure grew.
My conclusion here is that poor Disk IO performance placed SQL Server under memory pressure which became apparent sooner on the under resourced subscriber. The lesson learnt here is it's always worth running a second test, or having more than one performance diagnostic feature running, to confirm results and conclusions.
References
http://sqlcat.com/sqlcat/b/whitepapers/archive/2008/09/02/sql-server-replication-providing-high-availability-using-database-mirroring.aspx - Ideas for lab
http://www.johnsansom.com/ Ideas for lab
http://www.sqlstress.com/ - Load simulation
SQL Server 2008 Internals - Christian Bolton and Query Tuning Distilled, Grant Finchley for PERFMON counter recommendations, baselines and wait type descriptions.
http://pal.codeplex.com/ - Performance Analysis Log tool
http://technet.microsoft.com/en-us/library/ms179984.aspx - Wait Type Descriptions
