

Introduction
I was recently helping someone on a SQL forum calculate the percentile rank in SQL Server 2008. With SQL Server 2012+ it’s easy because you have the PERCENT_RANK rank distribution function, but on pre-2012 systems a little more work is required. The great thing about helping people on forums is how you often find yourself learning more than the person(s) you are helping. In this case I didn’t just come up with a way to do what PERCENT_RANK does on a pre-2012 system, I developed something better than PERCENT_RANK.
In this article we’ll examine PERCENT_RANK, how it’s calculated, then review a faster and more efficient alternative.
Test data for this article
We have a stored procedure for sample data named dbo.GenerateSalesData. It takes four parameters and creates a global temp table named ##sales with the columns: SaleID, SalesPersonID, SaleYear and SaleAmt. The parameters are:
- @years – the number of years to generate data for beginning with 2000 and incrementing by 1
- @RowsPerPartition – the number of sales for each year
- @MaxSalesPersons – the maximum number of salespeople
- @MaxSale – the highest possible value for the SaleAmt column.
dbo.GenerateSalesData creates (@years * @RowsPerPartition) rows of sample data.
Listing 1 - dbo.GenerateSalesData
IF OBJECT_ID('dbo.GenerateSalesData') IS NOT NULL DROP PROC dbo.GenerateSalesData;
GO
CREATE PROC dbo.GenerateSalesData
 (
  @Years            int, -- something to partition
  @RowsPerPartition int, -- records per partition  (year)
  @MaxSalesPersons  tinyint,
  @MaxSale          int  -- the lower this number, the more possible ties
)
AS -- ##Sales will hold the sample data
 IF OBJECT_ID('tempdb..##Sales') IS NOT NULL DROP TABLE ##Sales;
 CREATE TABLE ##Sales -- using global temp table so it's available after the proc executes
 (
   SaleID        int identity NOT NULL,
   SalesPersonID int NOT NULL,
   SaleYear      int NOT NULL,
   SaleAmt       int NOT NULL
 );
 WITH -- Create CTE tally table with 1,000,000 rows
 L1(N)     AS (SELECT 1 FROM (VALUES (1),(1),(1),(1),(1),(1),(1),(1),(1),(1))t(c)), --10
 L3(N)     AS (SELECT 1 FROM L1 a, L1 b, L1 c), -- 1,000 rows (10*10*10)
 iTally(N) AS (SELECT ROW_NUMBER() OVER (ORDER BY (SELECT 1)) FROM L3 a, L3 b),
 Years(Yr) AS (SELECT TOP (@years) 2000+N-1 FROM iTally)
 INSERT ##Sales(SalesPersonID, SaleYear, SaleAmt)
 SELECT SalesPersonID = ABS(CHECKSUM(newid())%@MaxSalesPersons)+1,
        SaleYear      = YR,
        SalesAmt      = ABS(CHECKSUM(newid())%@MaxSale)+1
 FROM Years CROSS JOIN iTally
 WHERE N <= @RowsPerPartition;
 -- Add PK & Clustered Index
 ALTER TABLE ##Sales ADD CONSTRAINT pk_Sales PRIMARY KEY CLUSTERED (SaleYear, SaleID);
 -- Add POC Indexes
 CREATE INDEX poc_sales__SaleAmt ON ##Sales(SaleAmt) INCLUDE (SaleYear, SalesPersonID);
 CREATE INDEX poc_sales__SaleYear_SaleAmt ON ##Sales(SaleYear, SalesPersonID) INCLUDE (SaleAmt);
Using PERCENT_RANK
First let’s look at what PERCENT_RANK does; according to BOL PERCENT_RANK:
Calculates the relative rank of a row within a group of rows... Use PERCENT_RANK to evaluate the relative standing of a value within a query result set or partition.
For each row in a partition (or entire set when the set is not partitioned), PERCENT_RANK ranks a value by calculating its rank minus 1 (rk - 1), and dividing that value by the number of rows in the partition minus 1 (nr - 1). For each row in a partition PERCENT_RANK returns (rk -1) / (nr - 1). A float value between 0 and 1 is returned which represents a percentage.
The example below calculates the percentile ranking for seven students based on their test score. For simplicity no partitioning is involved:
-- Sample Data
DECLARE @TestScores TABLE
  (
    Student VARCHAR(30) NOT NULL
  , TestScore TINYINT
  );
INSERT @TestScores
  VALUES
    ( 'Mike Ehrmantraut', 80 ),
    ( 'Todd Alquist', 91 ),
    ( 'Gustavo Fring', 83 ),
    ( 'Steven Gomez', 71 ),
    ( 'Tuco Salamanca', 59 ),
    ( 'Gale Boetticher', 94 ),
    ( 'James McGill', 68 );
-- Lets calculate where the students rank based on their test scores
SELECT
    Student
  , TestScore
  , PERCENT_RANK() OVER ( ORDER BY TestScore ) AS PercentRank
  FROM
    @TestScores;
The results are shown in Figure 1. In this example, for each student, PERCENT_RANK returns the percent of students who had a lower test score. For example, Todd did better than 83.33% of the other students, Gale did better than everybody, e.g. 100% of the other students which is represented as a 1. Tuco didn’t do better than anyone which is represented with a 0.
Figure 1 – Test Score Ranking Query Results:

How Not to calculate Percentile Rank
Before continuing lets first address some SQL folklore. NTILE is not for calculating percentile rank! I bring this up because I’ve seen people on popular SQL forums suggest otherwise. NTILE is a window ranking function used to divide rows into groups (AKA “tiles”) as evenly as possible. Unlike PERCENT_RANK, NTILE will sometimes assign a different tile number to equal values; this is because the distribution of tile numbers will always be the same regardless of ties. With PERCENT_RANK on the other hand, identical ranked values will always be assigned an identical PERCENTILE_RANK value. To demonstrate let’s use dbo.GenerateSaleData to generate 200 rows of sample data with a maximum SaleAmt of 2000, then use both PERCENT_RANK and NTILE(100) to calculate the percentile rank.
EXEC dbo.GenerateSalesData 1, 200, 5, 2000;
SELECT
  SalesPersonID,
  SaleAmt,
  [PERCENT_RANK] = 1. * PERCENT_RANK() OVER (ORDER BY SaleAmt),
  [NTILE(100)]   = 0.01 * (NTILE(100)  OVER (ORDER BY SaleAmt)-1)
FROM ##sales;
The results are shown in Figure 2, with the Percent_Rank and Ntile columns for comparison.
Figure 2 – PERCENT_RANK vs NTILE(100) Results:
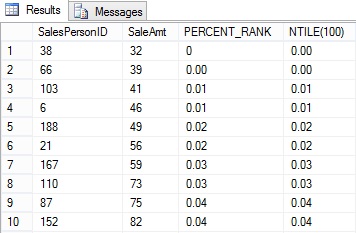
Note that, for screenshot simplicity, I formatted my PERCENT_RANK column results to look like the NTILE(100) results by truncating them like this: LEFT(CAST(1.*PERCENT_RANK() OVER (ORDER BY SaleAmt) AS varchar(10)), 4). Also note the results will be different on your SQL Instance because we’re dealing with randomized data.
Examining the first 10 rows it would appear (except for how the 0 is formatted) that NTILE(100) produces the same results as PERCENT_RANK. SalePersonID 103 & 6 are in the bottom 1%, 188 & 21 are in the bottom 2%, etc… But let’s see what happens when we generate 200 rows of sample sales data with the highest possible SaleAmt of 50.
EXEC dbo.GenerateSalesData 1, 200, 5, 50;
SELECT
  SalesPersonID,
  SaleAmt,
  PercentRank  = 1.*PERCENT_RANK() OVER (ORDER BY SaleAmt),
  [NTILE(100)] = 0.01 * (NTILE(100) OVER (ORDER BY SaleAmt)-1)
FROM ##sales;
Figure 3 – PERCENT_RANK vs NTILE(100) Results Part 2:
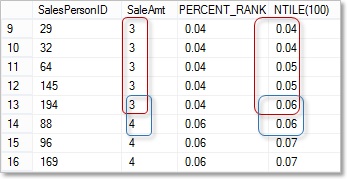
Examining rows 9-16 we have six sales people with a SaleAmt of 3 (circled in red). We’re ranking them by SaleAmt and, although SaleAmt is the same for all six people, the NTILE method gives us: two sales people ranked in the bottom 4%, two in the bottom 5% and one in the bottom 6%. Next notice how the two sales people in the bottom 6% (sales circled in blue) have different SaleAmt values but are ranked equally by NTILE(100). What a mess! PERCENT_RANK on the other hand, is calculating the percentile rank correctly.
Something else to consider is that, for the NTILE(100) method to work, you need at least 100 rows. Let’s say you only had 70 rows in your partition, then the highest percentile rank possible would be 70%. Lastly, NTILE is irrefutably the least efficient of the window ranking functions. One more time, say it with me: NTILE is not for calculating percentile rank!
Calculating Percentile Rank correctly without PERCENT_RANK
For calculating the PERCENT_RANK on pre-2012 systems I’ve been using a technique from SQL MVP Itzik Ben-Gan’s excellent book, Microsoft SQL Server 2012 High-Performance T-SQL Using Window Functions (page 70.) His solution uses the aforementioned (rk - 1) / (nr - 1) formula. Rank (rk) is calculated using RANK and the COUNT window aggregate function is used for the row count (nr). Here’s the solution using the sample data we generated earlier:
-- EXEC dbo.GenerateSalesData 1, 200, 5, 2000 -- run this again if needed
WITH C AS
(
  SELECT SalesPersonID, SaleYear, SaleAmt,
    rk = RANK() OVER (ORDER BY SaleAmt),
    nr = COUNT(*) OVER ()
  FROM ##Sales
)
SELECT SalesPersonID, SaleYear, SaleAmt,
  PercentileRank = 1.0*(rk-1)/(nr-1)
FROM C;
Now let’s compare the performance of this technique against PERCENT_RANK. We’ll use dbo.GenerateSalesData to generate 100,000 rows then run both solutions with STATISTICS IO ON and Include Actual Execution Plan turned on.
EXEC dbo.GenerateSalesData 1, 100000, 100, 2000;
SET STATISTICS IO ON;
PRINT CHAR(10)+'Pre-2012 solution:'; -- Pre-2012 Solution
WITH C AS
(
  SELECT SalesPersonID, SaleYear, SaleAmt,
    rk = RANK() OVER (ORDER BY SaleAmt),
    nr = COUNT(*) OVER ()
  FROM ##Sales
)
SELECT SalesPersonID, SaleYear, SaleAmt,
  PercentileRank = 1.0*(rk-1)/(nr-1)
FROM C;
PRINT 'Using PERCENT_RANK:'; -- PERCENT_RANK solution
SELECT SalesPersonID, SaleYear, SaleAmt,
  PercentileRank = 1.*PERCENT_RANK() OVER (ORDER BY SaleAmt)
FROM ##Sales;
SET STATISTICS IO OFF;
First let’s look at the IO statistics, specifically the reads:
Pre-2012 solution:
Table 'Worktable'. Scan count 3, logical reads 203210, physical reads 0, read-ahead reads 0, lob logical reads 0, lob physical reads 0, lob read-ahead reads 0.
Table '##Sales'. Scan count 1, logical reads 276, physical reads 0, read-ahead reads 0, lob logical reads 0, lob physical reads 0, lob read-ahead reads 0.
Using PERCENT_RANK:
Table 'Worktable'. Scan count 3, logical reads 202510, physical reads 0, read-ahead reads 0, lob logical reads 0, lob physical reads 0, lob read-ahead reads 0.
Table '##Sales'. Scan count 1, logical reads 276, physical reads 0, read-ahead reads 0, lob logical reads 0, lob physical reads 0, lob read-ahead reads 0.
200,000+ reads for 100,000 rows seems excessive for what we’re doing and what’s this worktable business about? Worktables are used by the SQL engine to hold temporary results. They’re created in the tempdb then dropped when no longer needed. Queries that require worktables typically generate a lot of reads and often (not always) perform badly. So, can they be avoided when calculating percentile rank? This brings us to the query execution plans.
Figure 4 – Execution plans for PERCENT_RANK and the Pre-SQL Server 2012 alternative:
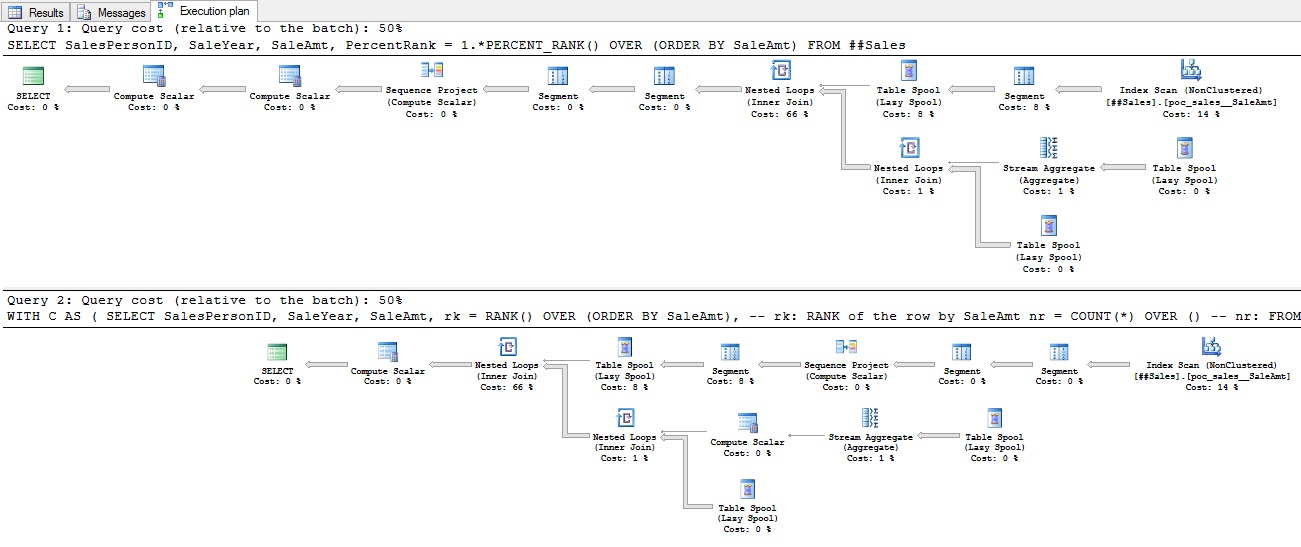
Notice that each execution plan includes three Table Spool (Lazy Spool) operators? This is where our worktables are coming from. Both queries require three Lazy Spool operators; this is common with many T-SQL window functions. For brevity, I’ll refer to plans with three Lazy Spool operators as triple spool plans. I don’t like triple spool plans; queries that generate them tend to perform poorly. PERCENT_RANK, NTILE (ironically) and window aggregate functions1 (such as SUM and COUNT combined with the OVER clause) generate triple spool plans. Run the query below against the ##sales table created earlier and make sure Include Actual Execution Plan is turned on:
SET STATISTICS IO ON;
SELECT COUNT(*) OVER () FROM ##sales;
SET STATISTICS IO OFF;
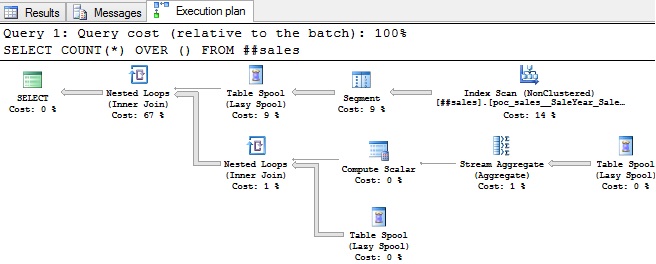
Note the execution plan and STATISTICS IO results below. As you can see, COUNT(*) OVER () generates a triple spool plan which generates a worktable which creates all those bloody reads.
Figure 5 – COUNT(*) OVER () Execution Plan:
STATISTICS IO results
Table 'Worktable'. Scan count 3, logical reads 201558, physical reads 0, read-ahead reads 0, lob logical reads 0, lob physical reads 0, lob read-ahead reads 0.
Table '##Sales'. Scan count 1, logical reads 274, physical reads 0, read-ahead reads 0, lob logical reads 0, lob physical reads 0, lob read-ahead reads 0.
Losing the “Triple Spool” Execution Plan
So now we know the window aggregate function is the culprit. Since we’re not partitioning the data yet (but will in a moment), the row count (nr) only needs to be calculated once. Let’s re-write the pre-2012 version like so:
SELECT SalesPersonID, SaleYear, SaleAmt, -- Below is the (rk – 1) / (nr – 1) calculation:
  PercentileRank = 1.*(RANK() OVER (ORDER BY SaleAmt)-1)/(SELECT COUNT(*)-1 FROM ##Sales)
FROM ##Sales;
Now let’s run it with SET STATISTICS ON, Include Actual Execution Plan turned on and review the results.
SET STATISTICS IO ON;
SELECT SalesPersonID, SaleYear, SaleAmt, -- Below is the (rk – 1) / (nr – 1) calculation:
  PercentileRank = 1.*(RANK() OVER (ORDER BY SaleAmt)-1)/(SELECT COUNT(*)-1 FROM ##Sales)
FROM ##Sales;
SET STATISTICS IO OFF;
Figure 6 – Execution plan for solution that does not use a window aggregate
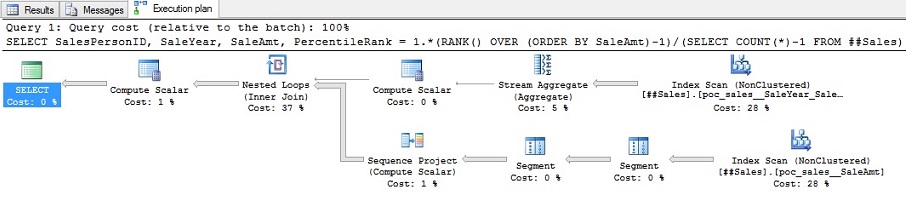
Now that’s more like it! The table spools are gone and we have a much cleaner plan. But how about those reads?
Table '##Sales'. Scan count 2, logical reads 550, physical reads 0, read-ahead reads 0, lob logical reads 0, lob physical reads 0, lob read-ahead reads 0.
After losing those pesky worktables we reduced the number of reads from 200,000+ to 550, a 99.8% reduction! But does this reduction mean better performance? Bring on the one million row test harness!!!
Note that, for one million rows on my system, the optimizer chooses a serial plan for the PERCENT_RANK query and a parallel execution plan for the new method. Depending on your server and settings a parallel plan is not guaranteed so I ran my solution twice, the second time with OPTION (MAXDOP 1) to force a serial plan. If you’re still playing along at home be sure to run this test with Include Actual Execution Plan turned off to avoid a small performance hit.
EXEC dbo.GenerateSalesData 1, 1000000, 100, 2000; -- 1,000,000 Row Performance Test
GO
PRINT 'Using PERCENT_RANK:';
GO
DECLARE @st datetime = getdate(), @pr numeric(32,11);
SELECT @pr = 1.*PERCENT_RANK() OVER (ORDER BY SaleAmt)
FROM ##Sales;
PRINT DATEDIFF(MS,@st,getdate());
GO 5
PRINT CHAR(10)+'AJB Method (parallel):';
GO
DECLARE @st datetime = getdate(), @pr numeric(32,11);
SELECT @pr = 1.*(RANK() OVER (ORDER BY SaleAmt)-1)/(SELECT COUNT(*)-1 FROM ##Sales)
FROM ##Sales;
PRINT DATEDIFF(MS,@st,getdate());
GO 5
PRINT CHAR(10)+'AJB Method (serial):';
GO
DECLARE @st datetime = getdate(), @pr numeric(32,11);
SELECT @pr = 1.*(RANK() OVER (ORDER BY SaleAmt)-1)/(SELECT COUNT(*)-1 FROM ##Sales)
FROM ##Sales
OPTION (MAXDOP 1);
PRINT DATEDIFF(MS,@st,getdate());
GO 5
Figure 7 – One Million Row Test Results (not partitioned):
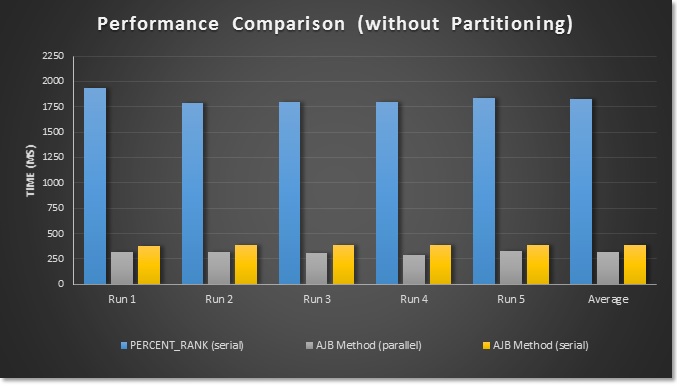
Getting rid of that window aggregate function resulted in a query that is 5-6 times faster. Even on 2012+ systems we now have a nasty fast alternative to PERCENT_RANK. Next let’s look at PERCENT_RANK when partitioning is involved.
Alternatives to PERCENT_RANK with Partitioning
There’s not much more to it when partitioning is involved. For the next example we’ll be partitioning by year so let’s create sales data for four years and 250,000 records for each year.
EXEC dbo.GenerateSalesData 4, 250000, 100, 2000;
GO
Next, let’s review how we would handle this using PERCENT_RANK.
SELECT SalesPersonID, SaleYear, SaleAmt,
  PercentRank = 1. * PERCENT_RANK() OVER (PARTITION BY SaleYear ORDER BY SaleAmt)
FROM ##Sales;
To deal with partitioned data using PERCENT_RANK we simply add the PARTITION BY clause. I came up with two alternatives that don’t use window aggregate functions. The first solution is to use RANK and the PARTITION BY clause to get the rank (rk) for each row per partition. Next a subquery groups and counts the records by year (nr). Then we use CROSS APPLY to pass the row count (nr) from the subquery to the outer query. Finally we divide the RANK-1 (rk -1 partitioned by SaleYear) by COUNT-1 (nr - 1) grouped by SaleYear. The inner and outer query are joined by SaleYear in the WHERE clause.
My second solution is nearly identical except that I do both my RANK and COUNT calculations inside a CTE. The first CTE (k) calculates the RANK (partitioned by SaleYear), the second CTE (r) groups and counts the rows by SaleYear. Next, both CTEs are joined by SaleYear in the WHERE clause. The outer query performs the final (rk - 1) / (nr - 1) calculation.
Solution #1
SELECT
  s.SalesPersonID,
  s.SaleYear,
  s.SaleAmt,
  PercentRank = 1.*(RANK() OVER (PARTITION BY s.SaleYear ORDER BY s.SaleAmt)-1)/(nr-1)
FROM ##Sales s
CROSS APPLY
(
  SELECT SaleYear, nr = COUNT(*)
  FROM ##Sales
  GROUP BY SaleYear
) r
WHERE r.SaleYear = s.SaleYear;
Solution #2
WITH
k AS
(
  SELECT
    s.SalesPersonID,
    s.SaleAmt,
    s.SaleYear,
    rk = RANK() OVER (PARTITION BY s.SaleYear ORDER BY s.SaleAmt)-1
  FROM ##Sales s
),
r AS
(
  SELECT SaleYear, nr = COUNT(*)-1
  FROM ##Sales
  GROUP BY SaleYear
)
SELECT k.SalesPersonID, k.SaleYear, k.SaleAmt, PercentRank = 1.*(k.rk)/(r.nr)
FROM k
CROSS APPLY r
WHERE r.SaleYear = k.SaleYear;
Though both solutions are nearly identical but they generate notably different execution plans.
Figure 8 – PERCENT_RANK alternatives (with partitioning) results:
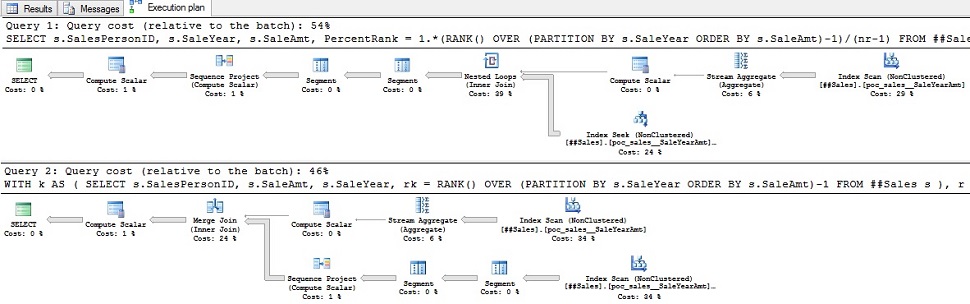
Neither query requires any sorting or lazy spools; both are logically the same and each generates roughly 5,500 reads per one million rows. In the first query the data is first grouped and counted (nr) by year, then joined using a nested loops join (Inner Join) algorithm. The rank is calculated and finally the (rk - 1) / (nr - 1) calculation is performed. In the second query the rank (rk) is calculated before the data is joined and the optimizer uses a merge join (Inner Join) algorithm. With my testing the second solution is faster by 4-5%. On my machine the optimizer selected parallel plan for the PERCENT_RANK solution so I also ran it with OPTION (MAXDOP 1) to force a serial plan. For each of my alternatives the optimizer selected a serial plan for each so I also ran them with Adam Machanic’s make_parallel to force a parallel plan. Now the million row tests…
EXEC dbo.GenerateSalesData 4, 250000, 100, 2000; --1M rows of test data: 4 partitions, 250K rows ea.
GO
PRINT 'Using PERCENT_RANK (parallel):';
GO
DECLARE @st datetime = getdate(), @pr numeric(32,11);
 SELECT @pr = 1.*PERCENT_RANK() OVER (PARTITION BY SaleYear ORDER BY SaleAmt)
 FROM ##Sales;
PRINT DATEDIFF(MS,@st,getdate());
GO 5
PRINT CHAR(10)+'Using PERCENT_RANK (serial):';
GO
DECLARE @st datetime = getdate(), @pr numeric(32,11);
 SELECT @pr = 1.*PERCENT_RANK() OVER (PARTITION BY SaleYear ORDER BY SaleAmt)
 FROM ##Sales
 OPTION (MAXDOP 1);
PRINT DATEDIFF(MS,@st,getdate());
GO 5
PRINT CHAR(10)+'AJB Method #1 (Serial):';
GO
DECLARE @st datetime = getdate(), @pr numeric(32,11);
 SELECT @pr = 1.*(RANK() OVER (PARTITION BY s.SaleYear ORDER BY s.SaleAmt)-1)/(nr-1)
 FROM ##Sales s
 CROSS APPLY
 (
  SELECT SaleYear, nr = COUNT(*)
  FROM ##Sales
  GROUP BY SaleYear
 ) r
 WHERE r.SaleYear = s.SaleYear
 OPTION (MAXDOP 1);
PRINT DATEDIFF(MS,@st,getdate());
GO 5
PRINT CHAR(10)+'AJB Method #1 (parallel):';
GO
DECLARE @st datetime = getdate(), @pr numeric(32,11);
 SELECT @pr = 1.*(RANK() OVER (PARTITION BY s.SaleYear ORDER BY s.SaleAmt)-1)/(nr-1)
 FROM ##Sales s
 CROSS APPLY
 (
  SELECT SaleYear, nr = COUNT(*)
  FROM ##Sales
  GROUP BY SaleYear
 ) r
 CROSS APPLY dbo.make_parallel()
 WHERE r.SaleYear = s.SaleYear;
PRINT DATEDIFF(MS,@st,getdate());
GO 5
PRINT CHAR(10)+'AJB Method #2 (serial):';
GO
DECLARE @st datetime = getdate(), @pr numeric(32,11);
 WITH
 k AS
 (
  SELECT SaleYear, rk = RANK() OVER (PARTITION BY SaleYear ORDER BY SaleAmt)-1
  FROM ##Sales
 ),
 r AS (SELECT SaleYear, nr = COUNT(*)-1 FROM ##Sales GROUP BY SaleYear)
 SELECT @pr = 1.*(k.rk)/(r.nr)
 FROM k
 CROSS APPLY r
 WHERE r.SaleYear = k.SaleYear
 OPTION (MAXDOP 1);
PRINT DATEDIFF(MS,@st,getdate());
GO 5
PRINT CHAR(10)+'AJB Method #2 (parallel):';
GO
DECLARE @st datetime = getdate(), @pr numeric(32,11);
 WITH
 k AS
 (
  SELECT SaleYear, rk = RANK() OVER (PARTITION BY SaleYear ORDER BY SaleAmt)-1
  FROM ##Sales
 ),
 r AS (SELECT SaleYear, nr = COUNT(*)-1 FROM ##Sales GROUP BY SaleYear)
 SELECT @pr = 1.*(k.rk)/(r.nr)
 FROM k
 CROSS APPLY r
 CROSS APPLY dbo.make_parallel()
 WHERE r.SaleYear = k.SaleYear;
PRINT DATEDIFF(MS,@st,getdate());
GO 5
Figure 9 – One Million Row Test Results (Partitioned):
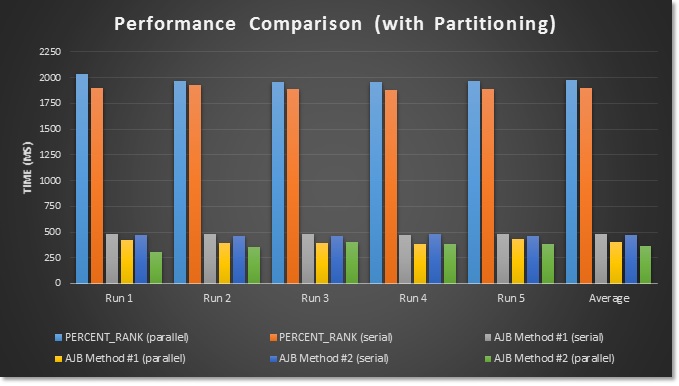
The results speak for themselves; both solutions blew the doors off PERCENT_RANK. Using Make_Parallel to force a parallel execution plan further improved performance for each alternative solution by roughly 20%.
Conclusion
So we’ve looked at how to calculate percentile rank using the T-SQL PERCENT_RANK rank distribution function and also by using RANK and the COUNT aggregate window function. We’ve examined the performance issues with PERCENT_RANK and aggregate window functions then reviewed some Nasty fast alternatives to Percent_Rank. We also reviewed why NTILE is not for calculating percentile rank.
I want to extend a special thank you to my friend Meghna Shukla for her contribution to this article. Thanks for reading.
One Final Thought
In December the SQL Server community lost a great person named Dwain Camps. Dwain’s mentoring, articles and forum posts revolutionized how I look at SQL and math. This article, for example, would not be possible without what I learned by reading The Performance of the T-SQL Window Functions. There’s a sentence in Dwain’s Simple-Talk.com Bio that reads, “By mentoring and authoring articles on SQL, [Dwain] hopes to train a future generation of software engineers on the right and wrong ways to deliver SQL code.” I’d like to think of myself as part of that “future generation” that benefited tremendously from Dwain’s teachings. I encourage anyone serious about writing SQL to study his articles which can be found on Simple-Talk, SQLServerCentral and DwainSQL.com.
Resources
- The Performance of the T-SQL Window Functions – Dwain Camps
- Percentile Rank Wikipedia Page
- PERCENT_RANK (BOL)
- NTILE (BOL)
- RANK (BOL)
- Microsoft SQL Server 2012 High-Performance T-SQL Using Window Functions – Itzik Ben-Gan
- Why the Lazy Spool Is Bad – Grant Fritchey
- Next Level Parallel Plan Forcing: An alternative to 8649 – Adam Mechanic
Footnotes:
1. Window Aggregate Functions combined with a window frame clause (discussed here) do not generate a triple spool plan.

