

The LAG function (as well as many other window functions) first appeared in SQL Server 2012. When it first appeared I thought, well, that’s a function I probably will not use, but just recently I used it in a bench-marking project for my new 2019 SQL Saturday index presentation. It just hit me that I’m so wrapped up in doing something the old way that I completely forgot about a better way to accomplish the same task with less resources and IO.
Microsoft describes the LAG function as accessing “data from a previous row in the same result set without the use of a self-join. LAG provides access to a row at a given physical offset that comes before the current row.” It turns out it is very useful for running totals and calculating differences between rows.
In my project, the problem I was trying to benchmark was a query that computes the date of the customer’s previous order and computes the difference between the previous order date and the current order date, using the AdventureWorks2012Big database. AdventureWorks2012Big is an AdventureWorks2012 database modified by a script from Jonathan Keyayias (http://sqlskills.com/blogs/jonathan) that bumps up the data in the Sales.SalesOrderHeader table from 31,465 rows to 1,290065 rows.
The tests below were run with SQL Server as described from SELECT @@VERSION :
Microsoft SQL Server 2017 (RTM-CU12) (KB4464082) - 14.0.3045.24 (X64)
Oct 18 2018 23:11:05
Copyright (C) 2017 Microsoft Corporation
Developer Edition (64-bit) on Windows 10 Pro 10.0 <X64> (Build 17134: )
So, my original query was
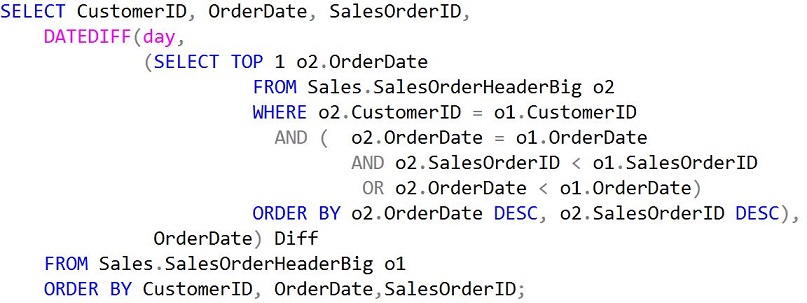
And when executed with the original AdventureWorks2012 indexes (clustered and nonclustered) had this execution plan:
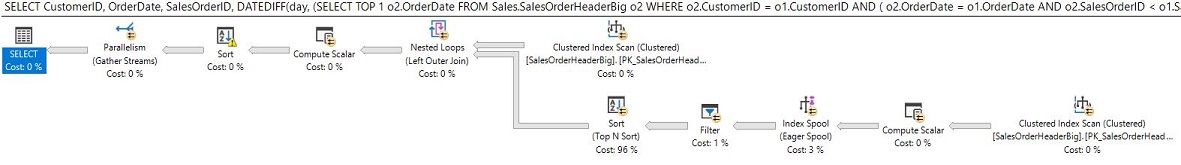
There are obviously two separate scans of the clustered index on Sales.SalesOrderHeader.
After looking at the above query plan I got to cogitating and remembered the LAG function. After looking up the syntax (web link above) I rewrote the query as
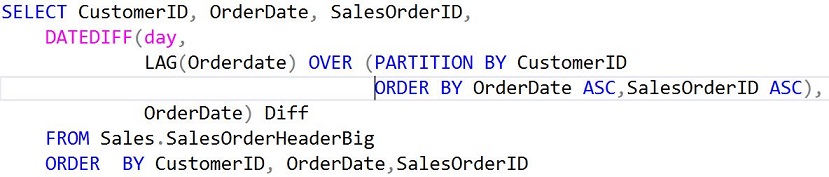
The results were identical to the original query, but with a much nicer query plan that looked like this:

This plan has only one clustered indexscan (much less logical IO) of Sales.SalesOrderHeader.
Comparing the performance numbers from each query gave me this:
Query 1 | Query 2 (LAG) | ||
Scan Count | 10 | 0 | |
Logical Reads | 59,842 | 30,022 | pages |
CPU time | 123,827 | 5,499 | ms |
Elapsed time | 28,209 | 8,246 | ms |
Query Cost | 15,731.6 | 63.0 |
The performance of the original query took about 28 seconds, but with the LAG function it took about 8 sec. The real performance gain was in the logical reads and cpu time. These kinds of performance gains can really catch the attention of a manager waiting for a report.
I bring this up because sometimes we get stuck in our ways and forget the new stuff. Once again this old dog re-learned a new trick.

