
One of the biggest barriers to initial adoption of Extended Events was the need for XQuery and XML knowledge in order to process and analyze data. Creating and running a session could be done with T-SQL, but regardless of the target used, data had to be parsed from XML. This limitation was removed in the SQL Server 2012 release with the implementation of the Extended Events User Interface. Largely unchanged in SQL Server 2014, the UI provides a way to create and manage sessions, as we saw in Level 2, and a way to view and manipulate data captured, which is what we'll explore in this level.
Viewing Data
Having created and started an extended events session, there are two options for viewing the event data: the live data viewer and the target data viewer.
To work along with the examples in this level, you can create the XE_SampleCapture event session shown in Listing 1. For events related to the completion of batch, statement and procedure execution, it these event fields (among others):
query_hash– identifies queries with very similar logic but separate plansquery_plan_hash– identifies separate plans that have the same operator tree structure
These fields are referred to as the query fingerprint and plan fingerprint, respectively. We use these fields primarily to analyze ad-hoc workloads, looking for very similar queries that differ on in small ways, such as having difference values of their concatenated literals.
CREATE EVENT SESSION [XE_SampleCapture] ON SERVER
ADD EVENT sqlserver.rpc_completed (
    ACTION ( sqlserver.database_id, sqlserver.query_hash,
    sqlserver.query_plan_hash )
    WHERE ( [sqlserver].[is_system] = ( 0 ) ) ),
ADD EVENT sqlserver.sp_statement_completed ( SET collect_statement = ( 1 )
    ACTION ( sqlserver.database_id, sqlserver.query_hash,
    sqlserver.query_plan_hash )
    WHERE ( [sqlserver].[is_system] = ( 0 ) ) ),
ADD EVENT sqlserver.sql_batch_completed (
    ACTION ( sqlserver.database_id, sqlserver.query_hash,
    sqlserver.query_plan_hash )
    WHERE ( [sqlserver].[is_system] = ( 0 ) ) ),
ADD EVENT sqlserver.sql_statement_completed (
    ACTION ( sqlserver.database_id, sqlserver.query_hash,
    sqlserver.query_plan_hash )
    WHERE ( [sqlserver].[is_system] = ( 0 ) ) )
ADD TARGET package0.event_counter,
ADD TARGET package0.event_file ( SET filename = N'C:\temp\XE_SampleCapture' ,
                                  max_file_size = ( 512 ) ),
ADD TARGET package0.histogram ( SET filtering_event_name = N'sqlserver.sql_statement_completed' ,
                                 slots = ( 16 ) ,
                                 source = N'sqlserver.database_id' ),
ADD TARGET package0.ring_buffer ( SET max_events_limit = ( 10000 ) ,
                                   max_memory = ( 4096 ) )
WITH ( MAX_MEMORY = 16384 KB ,
        EVENT_RETENTION_MODE = ALLOW_SINGLE_EVENT_LOSS ,
        MAX_DISPATCH_LATENCY = 30 SECONDS ,
        MAX_EVENT_SIZE = 0 KB ,
        MEMORY_PARTITION_MODE = NONE ,
        TRACK_CAUSALITY = ON ,
        STARTUP_STATE = OFF );
GO
Listing 1
In order to generate some sample event data, I ran Jonathan Kehayias's random workload generator script for AdventureWorks, using multiple client connects, and also created a couple stored procedures and called those repeatedly. You can download the scripts to create and run the stored procedures at the bottom of the article. Your output may not match mine exactly, but it should be similar.
Live data viewer
The Live Data Viewer is available regardless of the target selected or even if no target exists for the session, and simply displays the events as they are collected. To open the viewer, right-click on any running session and select Watch Live Data. You can use XE_SampleCapture session, created above, or perhaps the system_health event session if you prefer. Figure 1 shows some sample event data.
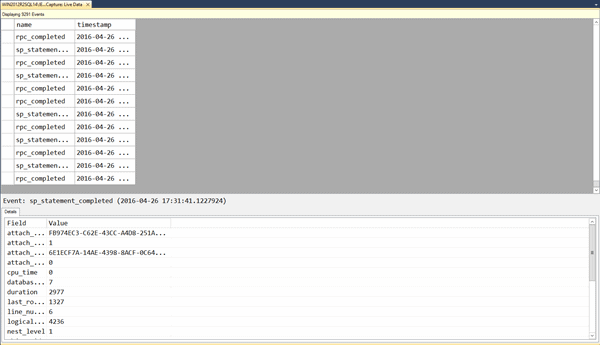
Figure 1
No data may appear initially, particularly if you're trying this out with the system_health session, because the speed with which events show up in the viewer depends primarily on what events you're collecting and your predicate(s). If you have an event session that should capture data quickly, then once the dispatch latency for the event session has been reached, or the intermediate buffers have filled, events will be dispatched to the viewer and to any targets defined for the session.
Dispatch latency and the memory buffers
The Extended Events engine writes the stream of event data first to intermediate memory buffers specific to the event session. The dispatch latency is a session-level option that defines the frequency, in seconds, at which the event data is flushed to the target, from memory.
Data in the live viewer does not persist unless you export the data. You can do this only if you have stopped the data feed into the Live Viewer (you can use the Stop Data Feed option form the main Extended Events menu). With the Live Viewer window selected, go to Extended Events | Export to and select the desired option for export.
You can stop the data feed or close the viewer at any time, and as mentioned in the previous level, the viewer will disconnect automatically if SQL Server determines it is adversely affecting performance.
Target data viewer
The second option to view data for an active session is to right-click on a specific target, and select the View Target Data…option. The view that displays from this menu option is specific to the target.
Viewing target data for the event_file target
If you have an event_file target, then viewing the target data displays the event data that has already been written to the file(s) on disk. This information does not refresh, it just displays what was in the file(s) at the moment you requested to view the data.
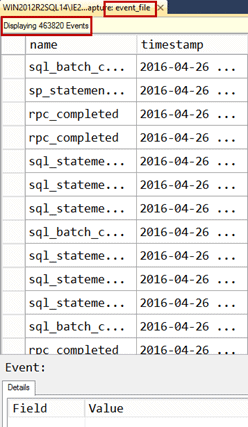
Figure 2
For an event_file target, the benefit of this option, versus the live data viewer, is that it does not require SQL Server to stream the data to Management Studio as well as to the target. It just reads the data already consumed by the target.
The events captured in an event_file target can be viewed after the event session is stopped in SQL Server Management Studio because they persist on disk, in .xel files. You can drag and drop a .xel file into SSMS, or use the File | Open | File… menu option and browse to a .xel file. The location for the .xel files for the system_health event session in the default error log folder.
This viewer looks exactly the same, except that the window name has the name of the file (XE_SampleCapture_0_131061823727010000.xel), whereas the Live or Target Data Viewer has the name event_file.
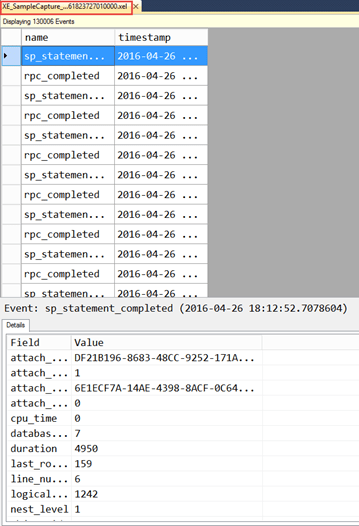
Figure 3
Viewing target data for the ring_buffer target
When using the ring_buffer target, the option to View Target Data is not particularly helpful, as the entire XML is displayed as a link.
![]()
Figure 4
Clicking on the link displays the data in XML format, but this is not useful for analysis.
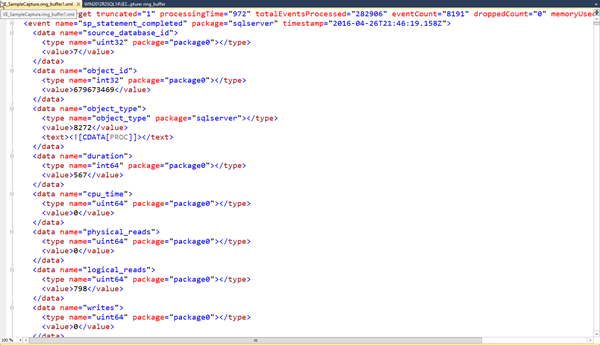
Figure 5
When using the ring_buffer target, we need to analyze the event data using XQuery.
Viewing target data for event_counter, histogram, and pair_matching targets
The last three targets, event_counter, histogram, and pair_matching, require you to either view the target data, or use XQuery, to analyze the data, as these are the only two ways to see the aggregate data. Using our XE_SampleCapture event session, or any event session with a histogram target, right click on the histogram target and open the target data views. Figure 6 shows some sample output.
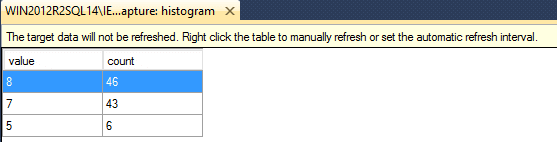
Figure 6
The histogram target data view may appear empty initially, or may appear with data. The viewer needs to be refreshed in order to see new data. To refresh it manually, right-click in the histogram target window and select Refresh, or you can select a Refresh Interval that will refresh the window automatically.
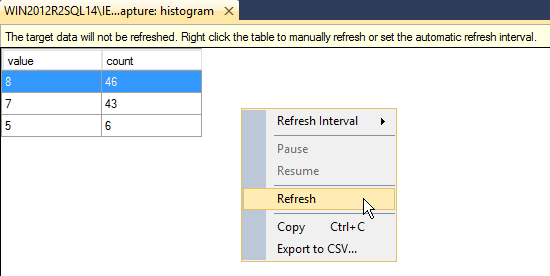
Figure 7
The histogram, event_counter, and pair_matching targets hold the data in memory, and once you stop the event session that memory is freed so the data in the target data viewer will disappear. If you want to save the data, you either need to copy it via the right-click Copy option, or save it to a .csv file via the right-click Export to CSV option (you can see this option in Figure 7, above).
You can stop an event session and then copy or save whatever is currently displayed in the target data view, for these targets, but if you refresh the viewer after you stop the session, the data will be lost.
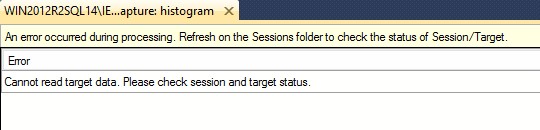
Figure 8
Display options: customizing columns
Within either viewer, you have the ability to customize the columns that are displayed. By default, only the event name and timestamp columns appear in the top pane, as these two columns are the only ones common to every event. When you select any row in the top pane, the Details pane below shows all fields captured. To view any field in the top pane, you can right-click on the row in the Details pane and select Show Column in Table. In Figure 9, I've added the duration field to the top pane.
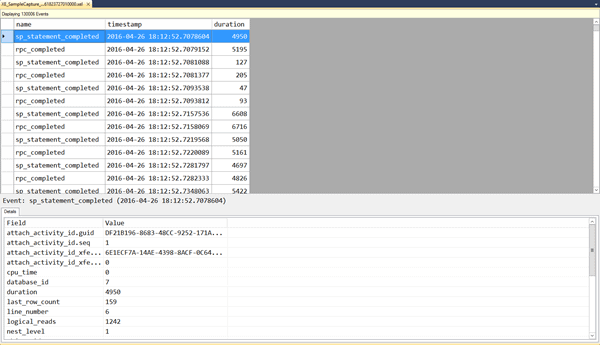
Figure 9
This step can be repeated for each field you want to display in the top pane. Columns can be moved right or left by clicking on the column name and dragging either direction. Alternatively, you can select columns through the Extended Events | Choose Columns… option, where you can also set the column order, or use the Choose Columns… button on the Extended Events toolbar. Use the View | Toolbars menu to select the Extended Events toolbar if you do not see it.
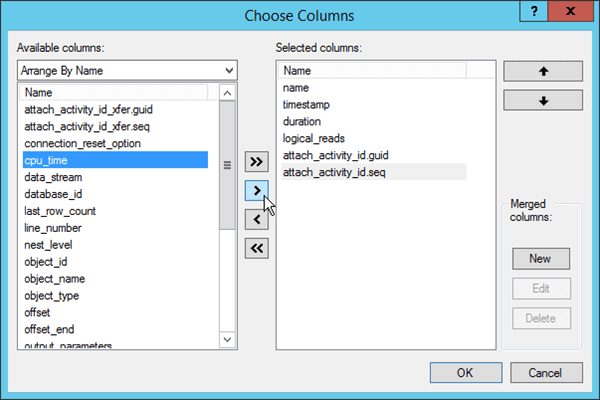
Figure 10
One of the neat tricks you can do in the viewer to customize your display even further is merge columns, in other words create a new column based on two or more columns. This is useful when you're capturing events which store query text in different fields. For example, the sp_statement_completed event uses the statement field to store query text, while batch_completed uses to the batch_text field for the text. If you add both fields to the top pane in the viewer, you'll notice that the statement field will always be NULL for the batch_completed event, and the batch_text field will always be NULL for the sp_statement_completed event.
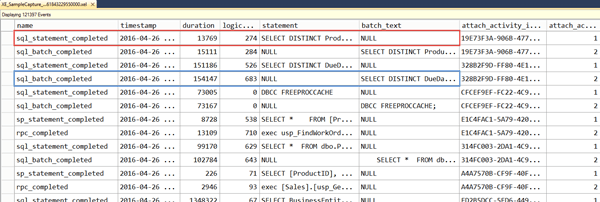
Figure 11
Having the data in different fields can hamper analysis, but merging the two columns into one alleviates this problem. Within the Choose Columns… window you will see a Merged columns on the right. Select New, provide a name for the new column, and then select the columns you want to merge, as shown in Figure 12.
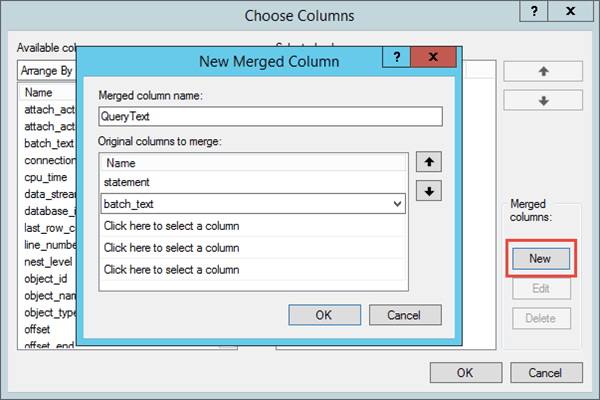
Figure 12
The new merged column will appear in the viewer with the name, [QueryText]. Note that the merged columns option is designed for concatenation of string fields, so if you select fields with non-string data types, not all fields will display properly. For example, if you try to concatenate logical_reads and database_id, it just displays logical_reads.
After you have customized the viewer to display the fields you want, in the order you want, you can save the configuration from the Extended Events menu (Display Settings | Save As…) or using the Display Settings button.
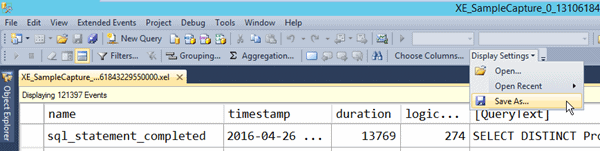
Figure 13
Save the configuration as a .viewsetting file, and then use the same menu to open the file when viewing and analyzing event_file targets in the future. These files can also be shared or saved to a network location for access by multiple users. Finally, if you want to remove the Details pane from the view, once all columns needed are displayed in the top half of the viewer, select Extended Events | Show Details Pane.
Analyzing Data
The viewer provides a view of event data that we are familiar with from the Profiler UI. But unlike the Profiler UI, where we just had the ability to re-order columns and filter out data, the extended events viewer provides better options for analysis that don't require exporting the data to a table or using a third-party tool.
Ordering
One of the simplest things you can do with event data is sort it. Simply right-click on the column name and select Sort Ascending or Sort Descending to order the data (you can also just click on the column name and it will sort it, and clicking on it again will sort it on the opposite order). When you're quickly trying to find events that have the longest duration, or the highest number of IOs, sorting the data in the UI is the easiest way.
Filtering
Use the Filters… button on the XE toolbar (or Extended Events | Filter…) to filter data in the viewer. We can filter by date/time ranges as well as using values in any of the fields, including global fields, collected for the events. Further, we can create complex filters, just as we can for our predicates, through the use of AND, OR, and multiple operators (=, <>, Like, Not Like, Null, and so on).
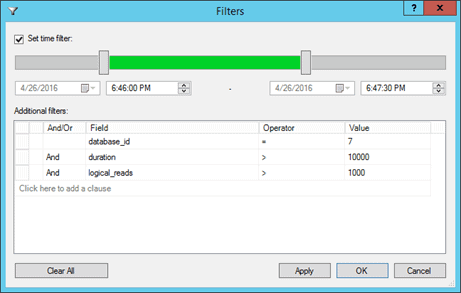
Figure 14
Having applied the filter, the result set can be saved as a new .xel file, if desired. If the original .xel file is closed without removing the filter, note that when it is re-opened, the filter will still be applied. A good habit is to always check the number of events displayed to know if any filters have been applied as part of the analysis, as indicated in Figure 15.
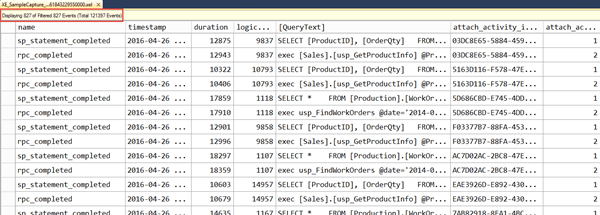
Figure 15
To remove all filters applied, you can go back into the filters window or select Extended Events | Clear All Filters.
Merging .xel files
While we very often want to filter the result set that we have to analyze, in some cases we need to pull together multiple files for comprehensive analysis. As an example, when troubleshooting an issue across multiple nodes of an Availability Group, you can set up the same event session on each node, then merge the target files from all nodes to view all data together. To do this, within Management Studio select File | Open | Merge Extended Events Files. Browse to the locations of the files and add each one, then select OK.
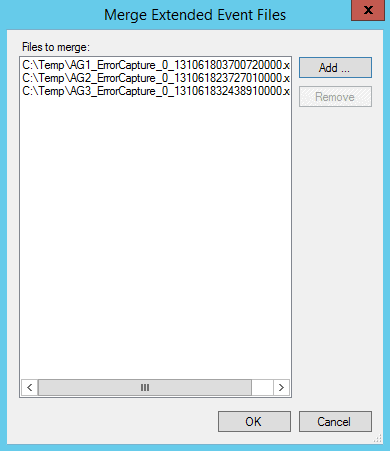
Figure 16
The merged files will display as one set output for analysis, and again you can save this as its own .xel file.
Search
The Profiler UI does provide the ability to search, which is useful when looking for a particular string of text in a query. The extended events viewer offers this same functionality, with a similar-looking binoculars icon in the toolbar (or select Extended Events | Find).
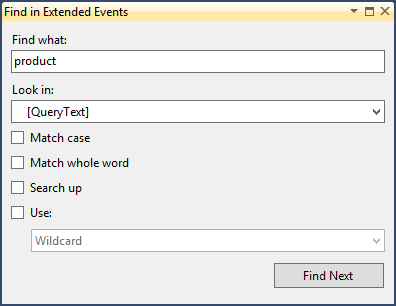
Figure 17
Within the Find window you can search for a value in any of the fields which you have added to the top pane. If you do not add any fields to the top pane of the viewer, then by default you can only search the name and timestamp columns. You can only select one field to search on at a time, and you have standard search options including Match case and Match whole word, as well as the ability to use wildcards or regular expressions.
Marking Rows
Having found rows containing the data of interest, you have the ability to bookmark them in the viewer (those of you familiar with Profiler may be used to writing down row numbers to remember where something was located…this is a thing of the past!). Highlight the row of interest and then select the Bookmark button in the Extended Events ribbon (you can also right-click on the row and select Toggle Bookmark). The bookmark icon will appear in the viewer to the left of the row.
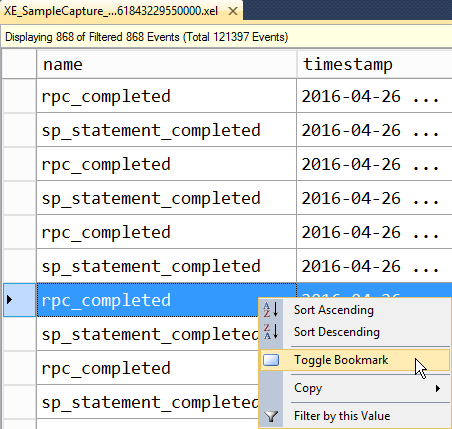
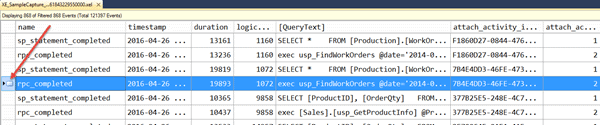
Figure 18
Once you have marked all rows that are of interest, you can revisit them quickly (without scrolling endlessly) using the forward and backward navigation buttons on the toolbar. These buttons allow you to roll through the file with ease, just stopping on the events of interest. If you need to remove an individual bookmark, just right-click on the row and select Toggle Bookmark. If you want to remove all bookmarks, select the Clear All Bookmarks button. Note that if you close the file and then re-open it later to continue analysis, any bookmarks will be lost.
Grouping
While merging columns, filtering data, and finding specific values in your event data can be fun and very useful for data analysis, it doesn't help us find trends or anomalies across the data as a whole. Enter grouping. This analysis option is one reason why the extended events viewer far exceeds Profiler. For any field you have selected in the top pane of the viewer, you can right-click on it and select Group by this column.
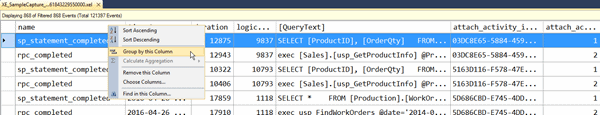
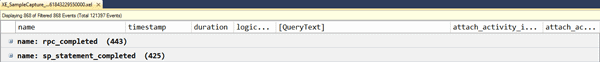
Figure 19
You can also use the Grouping… button or Extended Events | Grouping… options, which are preferable as they make it easier to group on multiple columns. From the viewer alone, after I have grouped on one column, if I right-click on another column and select Group by this column, it removes the original grouping. There may be some times where you want to group on multiple columns, and in that case, use the Grouping window, which allows for selection and ordering of one of more columns.
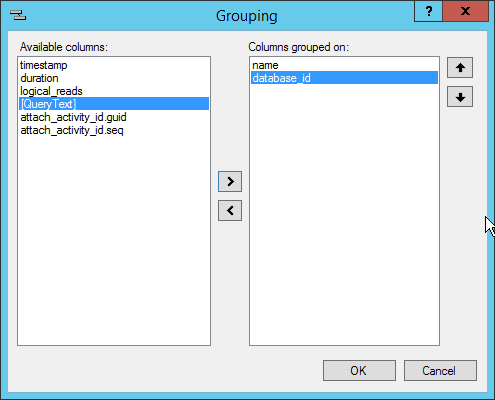

Figure 20
Common fields for grouping include:
event(the name of the event)object_nameorobject_iddatabase_nameordatabase_id- login fields (e.g.
username,nt_username) client_app_nameclient_hostname
Grouping on fields such as duration, logical_reads, and CPU isn't useful. Those fields provide metrics about an event, but it's not often you're looking for all events that complete in exactly 20ms, or those that require a specific number of IO. Rather, you're looking to find patterns or anomalies within events that come from a specific server, or a particular application, or within a database.
It's not uncommon to try and group by the statement (or batch_text), in order to find the query or queries that execute most frequently. When capturing data with SQL trace, the third party tools that you could use for analysis such as ClearTrace and ReadTrace could do this. Those tools normalized the text data and then aggregated it so you could see how often a specific query or stored procedure was executed.
Sadly, Extended Events does not have the ability to normalize text data. If you try to group on statement or batch_text (or the custom column QueryText) in the viewer, you'll end up with many rows that have a count of only 1 statement.
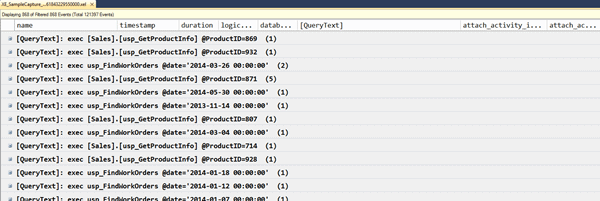
Figure 21
Instead of trying to group on the query text, you need to group on the query_hash or query_plan_hash fields, which were added to the sys.dm_exec_query_stats DMV in SQL Server 2008 and are often referred to as "query fingerprints."
Any queries that have the same text will have the same query_hash, so you can group on this field to see how frequently a query executes.
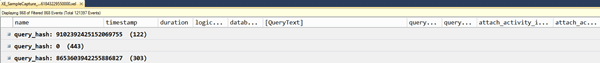
Figure 22
Once you are able to group together queries that are the same, you can then perform additional analysis for each grouping to understand averages, minimums, and maximums.
Aggregation
The final analysis tool in the UI is the aggregate option. There must be a grouping on at least one field before you can apply an aggregate. For non-numeric fields where math cannot be applied (e.g. batch_text, database_id, xml_report), the only aggregate option is COUNT. For numeric fields, additional options include SUM, MIN, MAX, and AVG. The aggregate option is applied by right-clicking on a field and selecting Calculate Aggregation…, then selecting from the list of available options. You can also use the Aggregation… button in the toolbar, or the Extended Events | Aggregation… menu option.
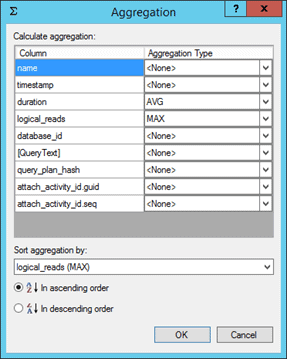
Figure 23
Figure 24 shows the aggregated results in the viewer.
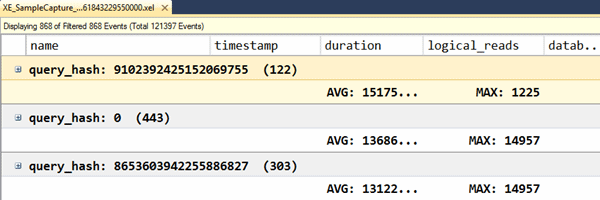
Figure 24
You can apply different aggregates to different fields, such as AVG for duration and MAX for logical_reads, but only one aggregate can be applied to a field at a time. That is, you can only view the AVG, or only the MAX for a field. There is an interesting way to work around this, if you're interested in viewing different aggregations for the same field. You can create a merged column that represents that column. For example, if I wanted to see the AVG duration and also the MAX duration, I would apply the AVG aggregation to the duration field, then I would create a merged column on the duration field (with a slightly different name) and another field that always has a zero value, such as connection_reset_option. Once you have the merged column, you can apply the MAX aggregation to it.
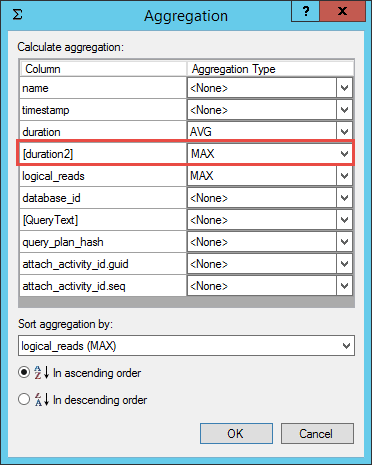
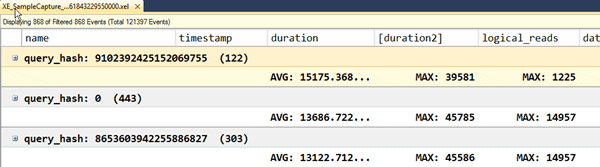
Figure 25
Merged columns persist after you close and re-open the file, but groupings and aggregates do not, and they are not stored in the .viewsetting file.
Summary
The biggest win for users, with the introduction of the target data viewer, in SQL Server 2012, is that it means we can to analyze event data without recourse to T-SQL and XQuery. The target data viewer allows us to view event data generated for all targets except the ring_buffer (and etw_classic_sync_target, where only ETW external tools can consume the data).
In addition, the extended events UI offers significantly more options for data analysis than we had in the Profiler UI. In addition to searching and filtering, we now have the ability to sort, group, and aggregate the data to perform much more comprehensive analysis that does not require saving the data to a table and writing scripts, or using a third-party tool, such as ReadTrace. Note that the latest version of ReadTrace does support the processing of .xel files, but specific events are required (refer to the ReadTrace documentation for more details and a sample extended events session).