The Stairway to DLM Dashboard covers the process of setting up your databases for monitoring in DLM Dashboard - a free tool that records schema changes on your databases, and alerts you to changes that haven’t been previously authorized.
The previous step covered the main benefits of DLM Dashboard, and how schema monitoring worked. In this step, we’ll learn how to install DLM Dashboard and start monitoring your databases. We’ll also create categories to organise databases according to your development process.
Before you start
You can install DLM Dashboard either on your local machine or a remote server, as long as the machine can communicate with the SQL Servers you want to monitor.
Before you get started, make sure your host machine meets these requirements:
Operating system: Windows 7 or Windows Server 2008R2 onwards
The latest version of Chrome or Firefox, or IE11
.NET Framework 4.5
SQL Server 2008, 2008R2, or 2012
SQL Server 2014 and 2016 are supported, with some limitations.
Install DLM Dashboard
You can download the latest DLM Dashboard installer from the Redgate site, here. Run the installer on the host machine and follow the steps to complete the installation.
DLM Dashboard installs three services on the machine to monitor databases, store configuration and host the web interface. If you ever encounter issues accessing DLM Dashboard, checking that these services are running is a good place to start.

Figure 2.1: DLM Dashboard services
Once the installation is complete, open a web browser and navigate to http://localhost:19528/. If prompted, enter your Windows login details to access DLM Dashboard for the first time.
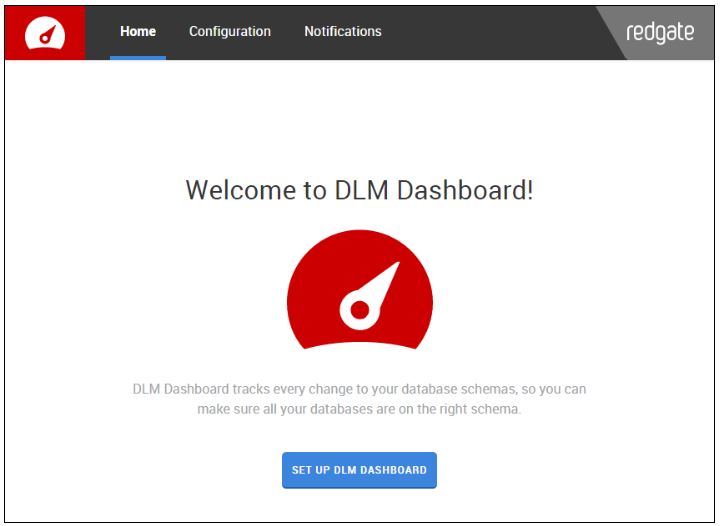
Figure 2.2: DLM Dashboard welcome screen.
From the welcome screen, select Setup DLM Dashboard to start adding your servers and databases.
Add and organize your databases
The first thing to do is add a SQL Server instance to DLM Dashboard - once added, you can monitor databases on that instance. Currently, the tool supports SQL Server 2008, 2008R2, 2012. SQL Server 2014 and 2016 are supported with some limitations.
On the Add a server page, enter the name of the server you want to connect to, and select an authentication method. The user you select must have the necessary permissions to create a DDL trigger.
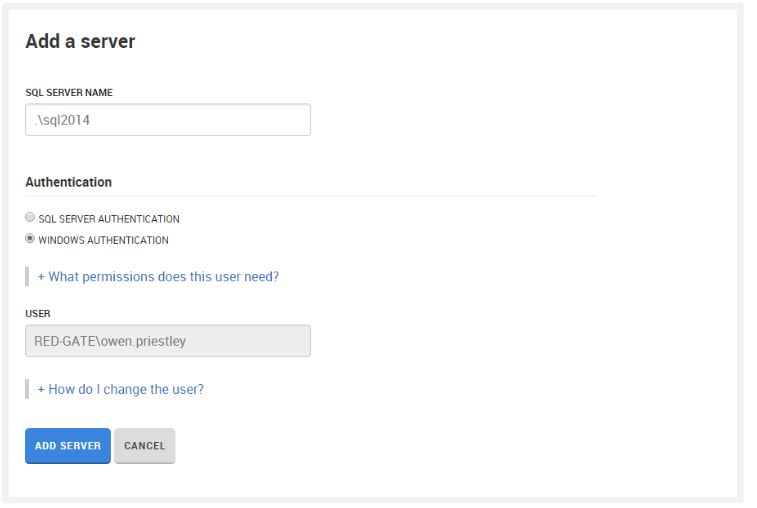
Figure 2.3: Adding a server in DLM Dashboard.
When you add a server for the first time, DLM Dashboard needs to prepare the server for monitoring. This involves creating several objects on the server:
a DDL trigger, to detect changes and trigger notifications
a Redgate database, to record schema change details
three stored procedures:
RG_SQLLighthouse_WriteEvents - This writes details of schema changes to the RedGate database.
RG_SQLLighthouse_ReadEvent - This procedure extracts details of schema changes from the RedGate database.
RG_SQLLighthouse_WriteError - This procedure logs any errors encountered when executing the DDL trigger.
To find more information about why these objects are required, see this documentation page.
DLM Dashboard can run a script against your server to automatically create the required object, which in most cases is fine. Alternatively, you can download and run the script yourself. If you select the latter option, you’re given a SQL script to run against the server.
Once you’ve setup a server for monitoring, DLM Dashboard lists all the databases on that server. Click the Add button next to any databases you want to start monitoring, and DLM Dashboard will begin tracking the schema on this database.

Figure 2.4: Adding databases to DLM Dashboard.
Once you’ve added a few databases, click View options from the toolbar to configure and customize the dashboard layout.
I’ve added four databases - Adventure_Dev, Adventure_Test, Adventure_Pre and Adventure_Prod - where each represents an environment or stage in my database lifecycle. Now that the databases are being monitored, it’s time to organise them to reflect my development process.
DLM Dashboard automatically groups databases into pipelines, and organises them into categories. Under Configuration, on the View options tab, you can rename the five default categories to reflect the relevant environments.

Figure 2.5: Renaming categories in DLM Dashboard.
Once you’ve established the categories you want to use, save the changes and click Home to head to the dashboard. This page displays all the databases currently being monitored, grouped into pipelines.
DLM Dashboard automatically creates pipelines for related databases:

Figure 2.6: The Adventure pipeline, with four environments configured.
My development process, represented in the above screenshot, is as follows: Development > Testing > Pre-Production > Production. If the automatically created pipeline doesn’t accurately reflect your development environment, you can reorganize and create new pipelines using the pipeline icon on each database:

Figure 2.7: Use the pipeline icon to move databases between pipelines.
Once pipelines are set up, you can use the dropdown category selector to get your databases into an order that accurately reflects your database lifecycle or development process:
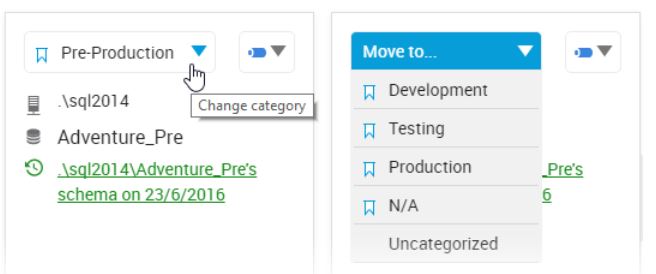
Figure 2.8: Use the category selector to move databases between categories.
Conclusion
In this level, we added the necessary objects to our SQL Server to prepare it for monitoring, and added that server to DLM Dashboard. We’ve now added some databases from that server to DLM Dashboard and organised them according to our database lifecycle or development process.
DLM Dashboard is now set up to monitor the databases, and will record any unrecognised schema changes from this point onwards. In the next installment, we’ll look at what constitutes an unrecognized schema change, how they’re represented, and learn how to investigate these changes through the DLM Dashboard interface.