

Introduction
SQL Server SSAS 2012 now includes two modes, dimensional and tabular. The later is a new in-memory OLAP database. Tabular databases can be queried using either MDX of DAX queries. This article demonstrates by example how to use the DAX query language against an in-memory tabular database. The article follows on from my previous article "DAX Query Basics". So far I've found there is a lot information available to aid writing DAX for excel pivot tables but not so much for bespoke client apps. This article will help you gain the skills to write your own queries directly against the tabular database.
Additional DAX Clauses
As well as the evaluate clause the DAX query language has three additional clauses, “define measure”, “order by” and “start at”. All three clauses are optional and I shall give examples of how each might be used.
Define Measure
Measures define derived data that exists for the duration of the DAX query. Using measures we are able to form a data query in a more digestible structure. They also allow us to reuse measures in subsequent more complex measure definitions.
Here is a very simple example of how a measure can be used with a summary query.
DAX
evaluate(
                summarize(
                                'Internet Sales',
                                [ProductKey],
                                "Total Sales", SUM('Internet Sales'[Sales Amount] )
                )
)
To change the DAX query to incorporate a simple measure we write the following…
DAX
define
                measure 'Internet Sales'[Total Sales] = SUM('Internet Sales'[Sales Amount] )
evaluate(
                summarize(
                                'Internet Sales',
                                [ProductKey],
                                "Total Sales", [Total Sales]
                )
)
If we take this a few steps further we can make a gross profit measure by including a total product cost measure and then subtracting it from the sales amount.
DAX
define
                measure 'Internet Sales'[Total Sales] = SUM('Internet Sales'[Sales Amount] )
                measure 'Internet Sales'[Total Product Cost] = SUM('Internet Sales'[Total Product Cost] )
                measure 'Internet Sales'[Total Gross Profit] = 'Internet Sales'[Total Sales] - 'Internet Sales'[Total Product Cost]
                measure 'Internet Sales'[Total Gross Profit2] = SUM( 'Internet Sales'[Gross Profit])
evaluate(
                summarize(
                                'Internet Sales',
                                [ProductKey],
                                "Total Sales", [Total Sales],
                                "Total Cost", [Total Product Cost],
                                "Total Gross Profit", [Total Gross Profit],
                                "Total Gross Profit2", [Total Gross Profit2]
                )
)
Here are the results…
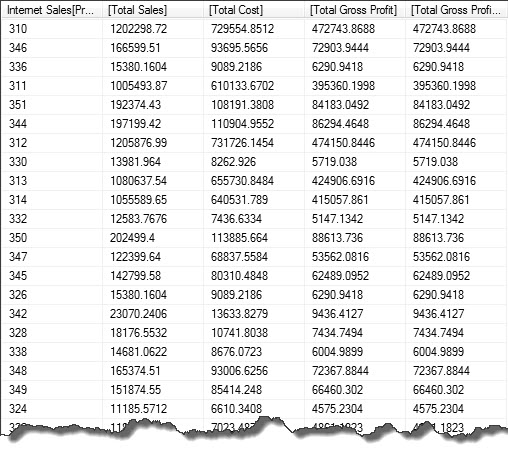
I have included a second gross profit measure to validate our calculation. The second gross profit measure summarizes a column which was derived as an additional column at the model level. It’s worth noting that the performance of the second gross profit column may be faster as only one column is consumed. However there is the overhead of calculating the column during data upload and storing it in ram.
If you were to write something similar in T-SQL it might looking something like the following.
T-SQL
with measures as
(
                select ProductKey , sum( SalesAmount ) as [Total Sales Amount], sum( TotalProductCost ) as [Total Product Cost]
                from [dbo].[FactInternetSales]
                group by ProductKey
)
select m.*
    , [Total Sales Amount] - [Total Product Cost] as [Total Gross Profit]
 from [dbo].[FactInternetSales] fis
  inner join measures m
   on m.ProductKey = fis.ProductKey
 group by m.ProductKey, m.[Total Sales Amount], m.[Total Product Cost]
Please note that this query may not be optimal as we are now querying a row storage database. It would make more sense to make the row calculations first and then summarize.
Start At
As well as the “define measure” and “evaluate” clauses the DAX query language has two additional clauses, “order by” and “start at”. The “order by” clause by itself is not particularly interesting. But when combined with “start by” we can achieve what can be considered the equivalent of an inverse TOPN with “order by”.
The following query will constrain a distinct list of productkey’s to just 2 rows…
DAX
evaluate( topn(2,
summarize('Internet Sales', [ProductKey])
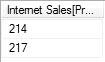
, [ProductKey], true)
)
order by [ProductKey]Here is the result...
We can make an inverse query by executing the following…
DAX
evaluate(
 summarize('Internet Sales', [ProductKey])
)
order by [ProductKey]
start at 222
Here is the result..
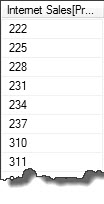
This query will return a distinct list of productkeys except the first two productkeys. This is of course an explicit query as it was necessary to know the third highest productkey up front. The TOPN and start at queries show how it is possible to constrain an ordered resultsets in many ways. Start at is also a useful clause when implementing pagination between the database and a client application.
Multi-Dimensional Queries
Up until now we’ve concentrated on very simple single table queries, as a simple way to first get use to the DAX language. In reality writing a query that manipulates just one table will be a very seldom occurrence. To create a multi-dimensional, or more accurately, a tabular query we can make use of the relationships defined in the model.
In T-SQL we always need to explicitly define the relationship in the query using the “…JOIN…ON” clause, which is a requirement I’ve always found to be superfluous. If we have a foreign between a table and a primary key on a reference table, then there is already a perfectly good relationship explicitly defined, so why do I have to redefine it in the query.
Oracle implements an implicit join (NATURAL JOIN) which goes some way towards using the schema definition for joins, but it’s not quite the whole solution as it relies on column names rather than explicitly defined relationships. DAX has kindly implemented this inference for us. If two or more tables are included in a query then they are implicitly joined on their “Active” relationship. I won’t go into much detail regarding “Active” relationships but basically it means the primary relationship defined between two tables to be inferred at query time and will often be the join most frequently used in tabular queries.
The following query gives an example of how inferred query joins are used…
DAX
define
measure 'Internet Sales'[Sum of Sales] = SUM('Internet Sales'[Sales Amount] )
evaluate(
summarize(
'Internet Sales',
'Sales Territory'[Sales Territory Region],
Geography[City],
Product[Product Name],
'Date'[Calendar Year],
"Sum of Sales", [Sum of Sales]
)
)
order by
'Sales Territory'[Sales Territory Region]
,Geography[City]
,Product[Product Name]
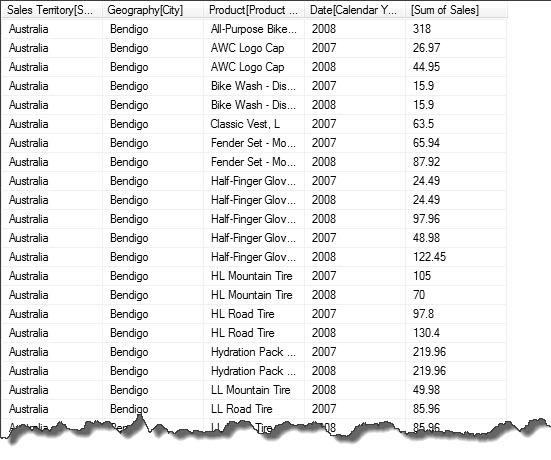
,'Date'[Calendar Year]By introducing columns from other tables in the cube (‘Sales Territory’, Geography, Product) the fact table ‘Internet Sales’ is automatically partitioned when calculating the aggregate( SUM).
Here is the result
Row and Filter Context
In the previous query each cell in the “Sum of Sales” measure is calculated within its own filter context. If we examine the first results row we see that the aggregate is performed on the ‘Internet Sales’[Sales Amount] column only after the ‘Internet Sales’ rows have been filter by
- ‘Sales Territory’[Sales Territory Region] = “Australia”
- Geography[City] = “Bendigo”
- Product[Product Name] = “All-Purpose Bike Stand”
- Date[Calendar Year] = 2008
‘Internet Sales’ is actually filtered via its inferred active relationships as it doesn’t actually have any of the columns mentioned above. The related tables are also filtered by the same values giving them their row context. Once filtered the remaining rows in the fact table (filter context) are then aggregated to return the scalar for the “Sum of Sales” cells. This certainly isn’t breaking any new query boundaries, but it gets more interesting when you are able to manipulate the filter context.
By combining the CALCULATE() function with the ALL() function we can manipulate the filter context. The CALCULATE() function allows any DAX expression to be re-evaluated in a specified filter context and the ALL() function allows us to ignore all or some of the current filter context. Using the two functions together we can define a measure that calculates the “Sum of Sales” over a super set of the original dataset defined in the query.
Here is how the query looks:
DAX
define
                measure 'Internet Sales'[Sum of Sales] = SUM('Internet Sales'[Sales Amount] )
                measure 'Internet Sales'[Product Universe] = calculate( 'Internet Sales'[Sum of Sales], ALL( Product[Product Name] ) )
evaluate(
                summarize(
                'Internet Sales',
                'Sales Territory'[Sales Territory Region],
                Geography[City],
                Product[Product Name],
                'Date'[Calendar Year],
                "Sum of Sales", [Sum of Sales],
                "Product Universe", [Product Universe]
                )
)
order by
 'Sales Territory'[Sales Territory Region]
,Geography[City]
,Product[Product Name]
,'Date'[Calendar Year]
Here is the result…
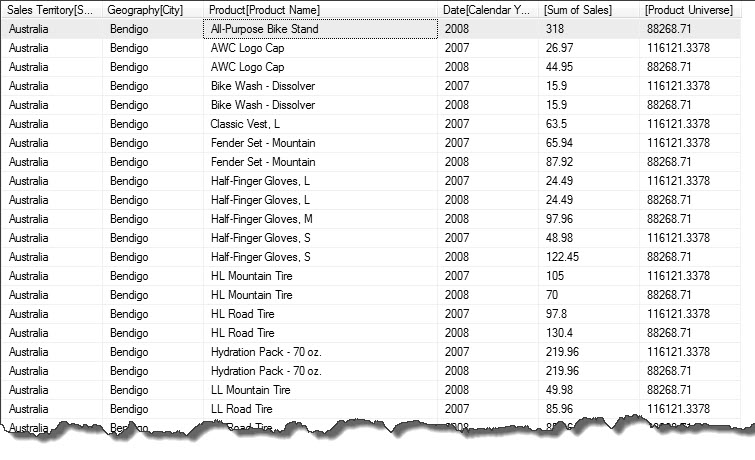
We have introduced a new measure to the query which asks for a recalculation of the “Sum of Sales” measure but this time the filter context has been modified to ignore the Product[Product Name]. This means we will get the sum of sales for all products for “Sales Territory” for “City” for “Calendar Year”. Using this product universe we can then go on to make a more interesting measure “Product Market Share”, by simply calculating the products percent in relation to the product universe figure.
DAX
define
                measure 'Internet Sales'[Sum of Sales] = SUM('Internet Sales'[Sales Amount] )
                measure 'Internet Sales'[Product Universe] = calculate( 'Internet Sales'[Sum of Sales], ALL( Product[Product Name] ) )
                measure 'Internet Sales'[Product Percent of Market] = ([Sum of Sales] / [Product Universe]) * 100
evaluate(
                summarize(
                'Internet Sales',
                'Sales Territory'[Sales Territory Region],
                Geography[City],
                Product[Product Name],
                'Date'[Calendar Year],
                "Sum of Sales", [Sum of Sales],
                "Product Market Share", 'Internet Sales'[Product Percent of Market]
                )
)
order by
 'Sales Territory'[Sales Territory Region]
,Geography[City]
,Product[Product Name]
,'Date'[Calendar Year]
Here is the result…
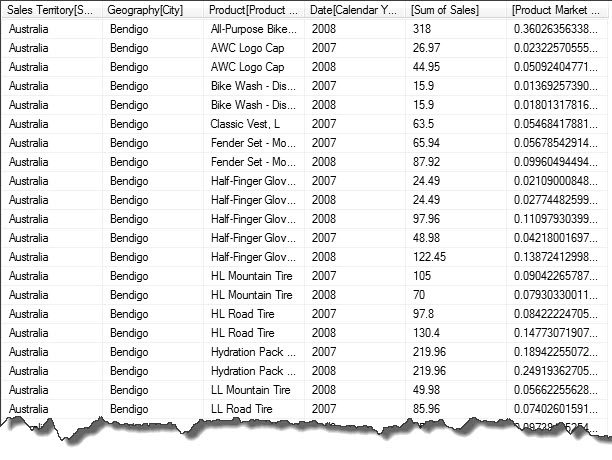
Now we can see that the “All-Purpose Bike..” product made up 36% of all products sold in Bendigo, Australia in 2008.
Format
Using the format() function we can format the result set columns to implement localized formatting information or visual attributes.
For instance we can express a number as a percentage…
DAX
evaluate (
                row ( "Number", 0.25, "Percent", FORMAT(0.25, "Percent")  )
)
We can utilize FORMAT() in our previous query to give our results set meaningful visual attributes and express the “Product Market Share” measure as a percentage.
DAX
define
                measure 'Internet Sales'[Sum of Sales] = SUM('Internet Sales'[Sales Amount] )
                measure 'Internet Sales'[Product Universe] = calculate( 'Internet Sales'[Sum of Sales], ALL( Product[Product Name] ) )
                measure 'Internet Sales'[Product Percent of Market] = FORMAT(([Sum of Sales] / [Product Universe]), "Percent" )
evaluate(
                summarize(
                'Internet Sales',
                'Sales Territory'[Sales Territory Region],
                Geography[City],
                Product[Product Name],
                'Date'[Calendar Year],
                "Sum of Sales", [Sum of Sales],
                "Product Market Share", 'Internet Sales'[Product Percent of Market]
                )
)
order by
 'Sales Territory'[Sales Territory Region]
,Geography[City]
,Product[Product Name]
,'Date'[Calendar Year]
Here is the result…
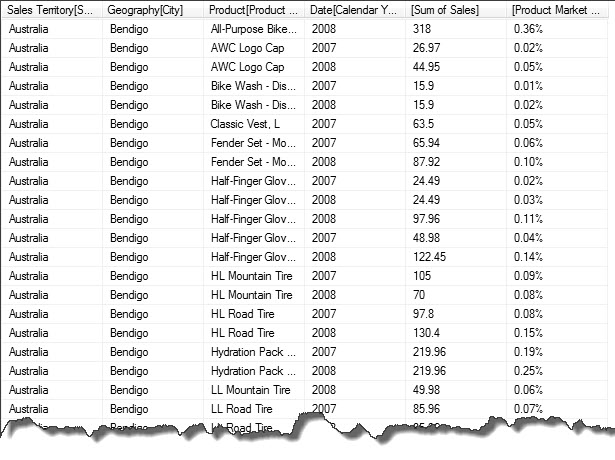
Note that there is no need to include the * 100 in the calculation as FORMAT() does it for us.
RANKX, SUMX, RELATEDTABLE
Using ranks makes it easier for data analysts and other report users to digest performance based information. We will add a rank measure and re-order the previous query.
So that we can calculate ranks over subsets in a query we will need to define a filter context (window). This can be achieved by combining the RANKX() and SUMX() functions. The first argument to the RANK() function requires that we supply a dataset over which to calculate rank, the second argument requires that we return a scalar value which will be consumed in the ranking process. We use SUMX() with RELATEDTABLE() instead of SUM() because we will need to define a new data subset (filter context) over which to calculate the sum for the ranking.
In the query below a simple rank column has been added and ordered on.
DAX
define
measure 'Internet Sales'[Sum of Sales] = SUM('Internet Sales'[Sales Amount] )
measure 'Internet Sales'[Product Universe] = calculate( 'Internet Sales'[Sum of Sales], ALL( Product[Product Name] ) )
measure 'Internet Sales'[Product Percent of Market] = FORMAT(([Sum of Sales] / [Product Universe]), "Percent" )
measure 'Internet Sales'[Rank] = RANKX( ALL( Product[Product Name]), SUMX(RELATEDTABLE('Internet Sales'),[Sales Amount] ) )
evaluate(
summarize(
'Internet Sales',
'Sales Territory'[Sales Territory Region],
Geography[City],
'Date'[Calendar Year],
Product[Product Name],
"Sum of Sales", [Sum of Sales],
"Rank", [Rank],
"Product Market Share", 'Internet Sales'[Product Percent of Market]
)
)
order by
'Sales Territory'[Sales Territory Region]
,Geography[City]
,'Date'[Calendar Year]
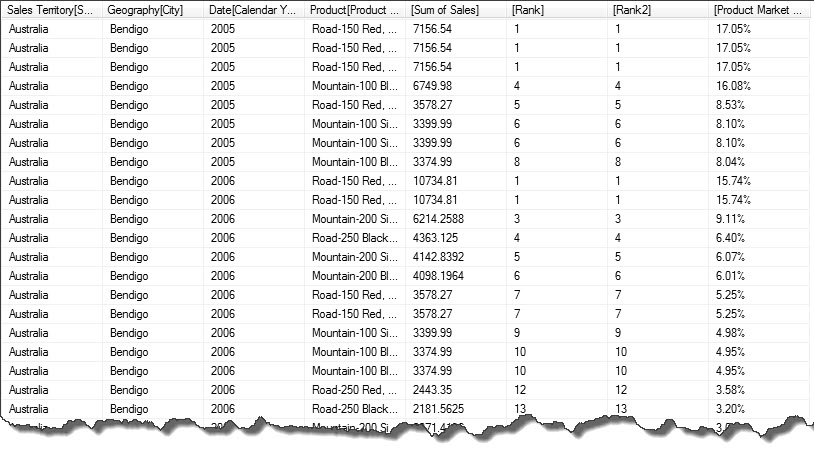
,'Internet Sales'[Rank]Here is the result…
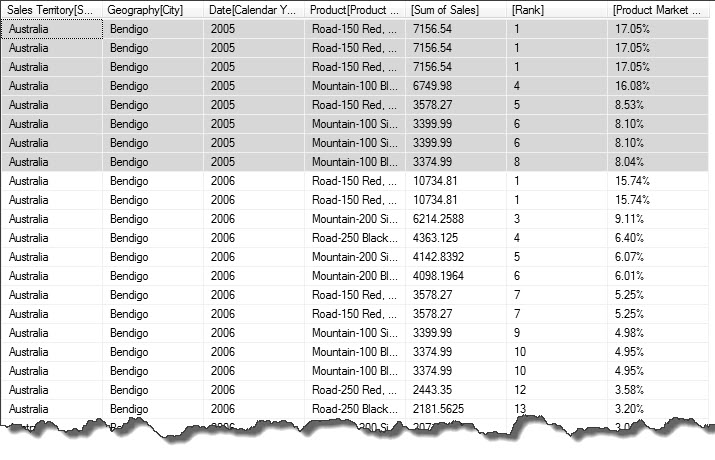
By supplying “ALL( Product[Product Name])”) we have specified that we want our rank to be partitioned by [Sales Territory Region], [City] and [Calendar Year]. If we simply went on to use SUM() instead of SUMX() we would only have access to the filter and row context already defined in the first argument “ALL( Product[Product Name])” therefore we would always sum all the values in the partition, giving a rank or 1 for every cell. Instead we use SUMX() with RELATEDTABLE(). Using RELATEDTABLE() we can alter the filter context by referencing the ‘Internet Sales’ table again, the row context is inferred as we now have a self-join. With DAX any row filter is always applied to related tables.
The rows highlighted in the result show us which products are the best performers in the geography Bendigo, Australia during the year 2005.
Understanding row and filter context is really very difficult, it’s also very difficult to explain in a short document. Take your time and experiment with various queries, in time it will become clearer.
CALCULATE
We can also achieve the same results by using the CALCULATE() function to alter the filter context. In the query below a second rank column has been added to show this.
DAX
define
                measure 'Internet Sales'[Sum of Sales] = SUM('Internet Sales'[Sales Amount] )
                measure 'Internet Sales'[Product Universe] = calculate( 'Internet Sales'[Sum of Sales], ALL( Product[Product Name] ) )
                measure 'Internet Sales'[Product Percent of Market] = FORMAT(([Sum of Sales] / [Product Universe]), "Percent" )
                measure 'Internet Sales'[Rank] = RANKX( ALL( Product[Product Name]), SUMX(RELATEDTABLE('Internet Sales'),[Sales Amount] ) )
                measure 'Internet Sales'[Rank2] = RANKX( ALL( Product[Product Name]), calculate( SUM('Internet Sales'[Sales Amount] ) ) )
evaluate(
                summarize(
                'Internet Sales',
                'Sales Territory'[Sales Territory Region],
                Geography[City],
                'Date'[Calendar Year],
                Product[Product Name],
                "Sum of Sales", [Sum of Sales],
                "Rank", [Rank],
                "Rank2", [Rank2],
                "Product Market Share", 'Internet Sales'[Product Percent of Market]
                )
)
order by
 'Sales Territory'[Sales Territory Region]
,Geography[City]
,'Date'[Calendar Year]
,'Internet Sales'[Rank]
Here is the result…
The CALCULATE() function allows us to re-define the filter context in the same way that SUMX() does. CALCULATE() brings in the row context so we are then able to combine the function with SUM() to calculate the same scalar to be evaluated during the ranking process.
The CALCULATE() function is a very powerful and frequently used function in DAX. You will find many uses for it and its sister function CALCUALTETABLE() so it’s worth spending some time getting familiar with it and understanding it fully.
Time Intelligence
DAX has a number of built-in time intelligence functions which allow us to easily form queries that reference a time dimension to produce measures based on events over time.
A frequent requirement in report production is the ability to compare two or more periods of time. Companies will always be interested in how their sales this year compared with last year. We can construct this query very easily using the PREVIOUSYEAR() function. In the following query the CALCUALTE() function is used to modify the filter context and the PREVIOUSYEAR () function is then used to change the filter context to use the previous year value of the Date[Calendar] dimension.
Time intelligence functions are only possible when a date dimension receives a special “Date” attribute during the model design of the tabular cube.
DAX
define
                measure 'Internet Sales'[Sum of Sales]= SUM('Internet Sales'[Sales Amount] )
                measure 'Internet Sales'[Previous Year]= CALCULATE( [Sum of Sales], PREVIOUSYEAR( 'Date'[Date] ) )
evaluate(
                summarize(
                'Internet Sales',
                'Sales Territory'[Sales Territory Region],
                Geography[City],
                Product[Product Name],
                'Date'[Calendar Year],
                "Sum of Sales", [Sum of Sales],
                "Previous Year", [Previous Year]
                )
)
order by
 'Sales Territory'[Sales Territory Region]
,Geography[City]
,Product[Product Name]
,'Date'[Calendar Year]
Here is the result…
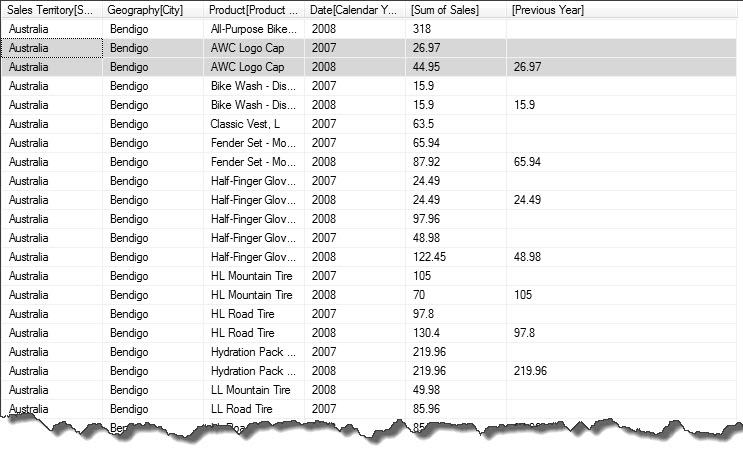
After studying the result set you will see that we have in fact pivoted the “Sum of Sales” value for the previous year into a new column.
We can now go onto evaluate the growth or decay of sales between the two periods by adding in some additional measures.
DAX
define
                measure 'Internet Sales'[Sum of Sales]= SUM('Internet Sales'[Sales Amount] )
                measure 'Internet Sales'[Previous Year]= CALCULATE( [Sum of Sales], PREVIOUSYEAR( 'Date'[Date] ) )
                measure 'Internet Sales'[Growth Decay]= [Sum of Sales] - [Previous Year]
                measure 'Internet Sales'[Growth Decay Percent] = FORMAT([Growth Decay] / [Previous Year], "Percent")
evaluate(
                summarize(
                'Internet Sales',
                'Sales Territory'[Sales Territory Region],
                Geography[City],
                Product[Product Name],
                'Date'[Calendar Year],
                "Sum of Sales", [Sum of Sales],
                "Previous Year", [Previous Year],
                "Growth/Decay", [Growth Decay],
                "Growth/Decay %", [Growth Decay Percent]
                )
)
order by
 'Sales Territory'[Sales Territory Region]
,Geography[City]
,Product[Product Name]
,'Date'[Calendar Year]
Here is the result…
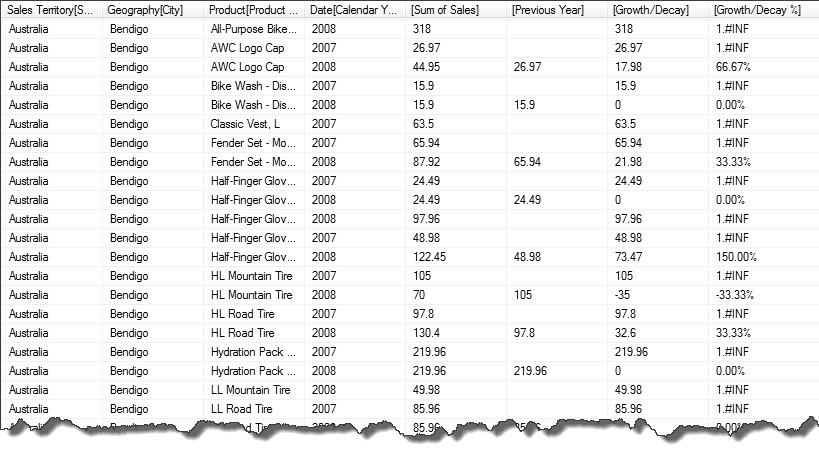
Our DAX query is now producing a result set that could potentially be used in a report of some kind. However we have a problem when we divide by zero, this will need to be fixed.
Blank, If, IfError
Using a combination of DAX functions we are able to mitigate divide by zero errors and other calculations errors that might arise. I will explain each in turn and then describe how they can be combined to tidy up measures.
Blank
Blank should not be confused with null’s. When a blank is used it is more aligned with the concept of empty rather than no value. When Blank() is used the context of string types, it could be considered similar to the c# empty string. Blank() used in numerical aggregation will allow the aggregation to complete by simply ignoring the blank values, whereas if a null is included in an aggregation the result will always be null.
If
The if() function is a simple logical gate. The first parameter is the test condition and the second and third parameters are the true and false states respectively.
IfError
The IfError() function is a specialized version of the if statement where the test condition is always to test using the function iserror().
Using the functions together we can define two methods for protecting against divide by zero…
DAX
evaluate(
                row(
                                "Method1", IFERROR(1/0, VALUE(BLANK()))
                                "Method2", IF(0 <> 0, 1/1, VALUE(BLANK()))
                )
)
In this context they are pretty meaningless, but when added to the previous query they help tidy it up.
DAX
define
measure 'Internet Sales'[Sum of Sales]= SUM('Internet Sales'[Sales Amount] )
measure 'Internet Sales'[Previous Year]= CALCULATE( [Sum of Sales], PREVIOUSYEAR( 'Date'[Date] ) )
measure 'Internet Sales'[Growth Decay]= [Sum of Sales] - [Previous Year]
measure 'Internet Sales'[GrowthDecayPercent]= [Growth Decay] / [Previous Year]
measure 'Internet Sales'[GrowthDecay %1] = FORMAT(IFERROR([GrowthDecayPercent], VALUE(BLANK())), "Percent")
measure 'Internet Sales'[GrowthDecay %2] = FORMAT( IF([Previous Year] <> 0, [GrowthDecayPercent], VALUE(BLANK())), "Percent")
evaluate(
summarize(
'Internet Sales',
'Sales Territory'[Sales Territory Region],
Geography[City],
Product[Product Name],
'Date'[Calendar Year],
"Previous Year", [Previous Year],
"Sum of Sales", [Sum of Sales],
"Growth/Decay", [Growth Decay],
"Growth/Decay %1", [GrowthDecay %1],
"Growth/Decay %2", [GrowthDecay %2]
)
)
order by
'Sales Territory'[Sales Territory Region]
,Geography[City]
,Product[Product Name]
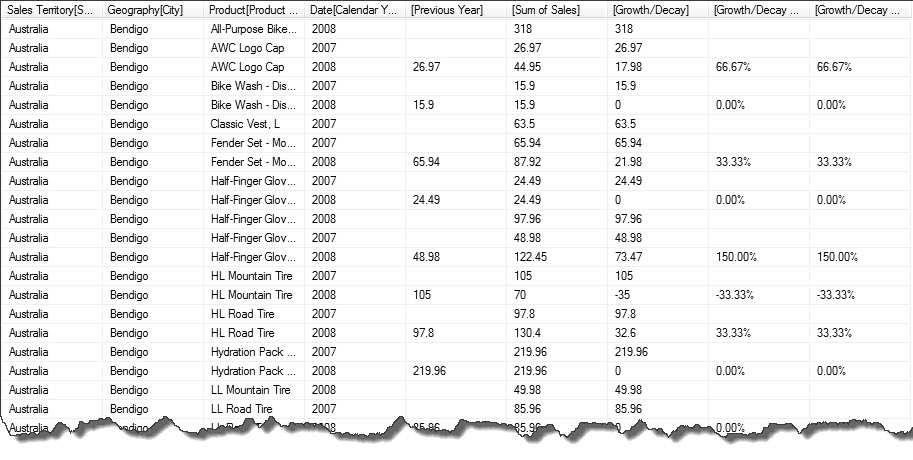
,'Date'[Calendar Year]Here is the result…
Conclusion
Hopefully this document has delivered some useful examples and increased your knowledge of the DAX language. I truly believe that once you have fully understood row and filter contexts then you are well on your way to becoming a DAX query author.
In a follow up article I will progress into more complex DAX.
