
In this Level of the series, we continue our examination of DAX function / iterator pairs, with the Concatenate() and ConcatenateX() functions. Concatenate() answers the need to join two text strings into a single text string, while ConcatenateX() enables us to meet the requirement to return the concatenation of an expression evaluated for each row in a table.
As a part of our introduction, we will discuss ways in which we can employ Concatenate() and ConcatenateX(). We’ll look at each function in standalone scenarios, as well as in situations where we combine it with other functions, when appropriate, to meet the business requirements of clients, employers or peers in our own environments. During our exploration of the Concatenate() and ConcatenateX() functions, we will:
- Examine the syntax involved in exploiting each;
- Undertake illustrative examples of the use of each function in practice exercises;
- Briefly discuss the results datasets we obtain in each of the practice examples.
We will examine the output we obtain using these two functions within Power BI Desktop in the practice session that follows our overview and explanation of the purpose and operation of each function. We will create calculated columns and measures that put Concatenate() and ConcatenateX() to work in Power BI Desktop visualizations we create (Report view), to further examine and extend the behavior that we will have observed in columns created in the Data view. Along the way, we will compare and contrast differences in use and behavior of the functions in columns and measures in general, suggesting criteria to consider in choosing which of these calculation types to employ to meet the business requirements we encounter.
In Stairway to DAX and Power BI - Level 10: Function / Iterator Function Pairs: The DAX Product() and ProductX() Functions, we also give guidance on preparation for the Levels of Stairway to DAX and Power BI, including the installation of Power BI Desktop and DAX Studio, as well as guidance in keeping Power BI Desktop updated for new updates.
Preparation for the Practice Exercises in this Level
Once you’ve installed Power BI Desktop, you are ready to import data that you can use to complete the practice exercises.
Download Samples for Use in this Level
To complete the steps of the hands-on practice in this Level, you’ll need to download the Contoso Sales Sample for Power BI Desktop file. This .pbix file already includes online sales data from the fictitious company, Contoso, Inc. (a familiar organization for many of us in the SQL Server and Excel arenas). Because data in the file was imported from a database, you won’t be able to connect to the data source or view it in Query Editor. (We will import data directly in Levels where we need to be able to accomplish this, and other requirements that go beyond working with DAX, in simple, isolated scenarios.)
Once the sample .pbix file is downloaded, you can take the following steps to open it in Power BI Desktop. This will put us in position to begin learning the material in this Level.
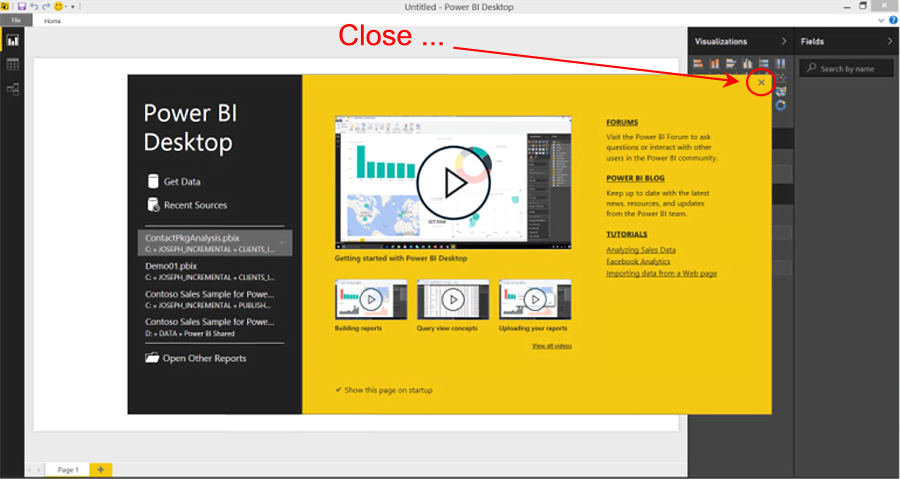
Illustration 1: Close the Splash Dialog that Appears in Power BI
- Open Power BI Desktop.
- Click the “X” button in the upper right corner of the splash dialog that appears upon entry, atop the Power BI Desktop interface, as shown.
- Select File - Open from the main menu.
 Illustration 2: Select File - Open in Power BI
 - Locate and open the downloaded sample file, Contoso Sales Sample for Power BI Desktop.pbix, from the Open dialog, as shown.Illustration 3: Select the Sample File …
- Click Open.The .pbix file opens and we see the member tables within the Fields pane on the right side of the desktop.Illustration 4: The Model Opens in Power BI Desktop …
Let’s leave the Report view (our current position in Power BI Desktop, which is indicated by the yellow bar that appears to the immediate left of the Report view icon), and look over the newly opened model from the tandem perspectives of Data and Relationships.
- Click the Data view icon along the left of Power BI Desktop (the middle of the three icons).The data for one of the tables listed in the Fields pane on the right of the desktop appears below (in the immediate case, the Calendar table’s data is partially displayed).Illustration 5: Power BI Desktop Data View
We can examine each table, as well as add columns and measures, within this view, as we will see throughout prospective Levels of this Stairway.
- Click the Relationships view icon next, just below the Data view icon we last clicked.The schema, with relationships between tables, appears.
Illustration 6: Relationships View
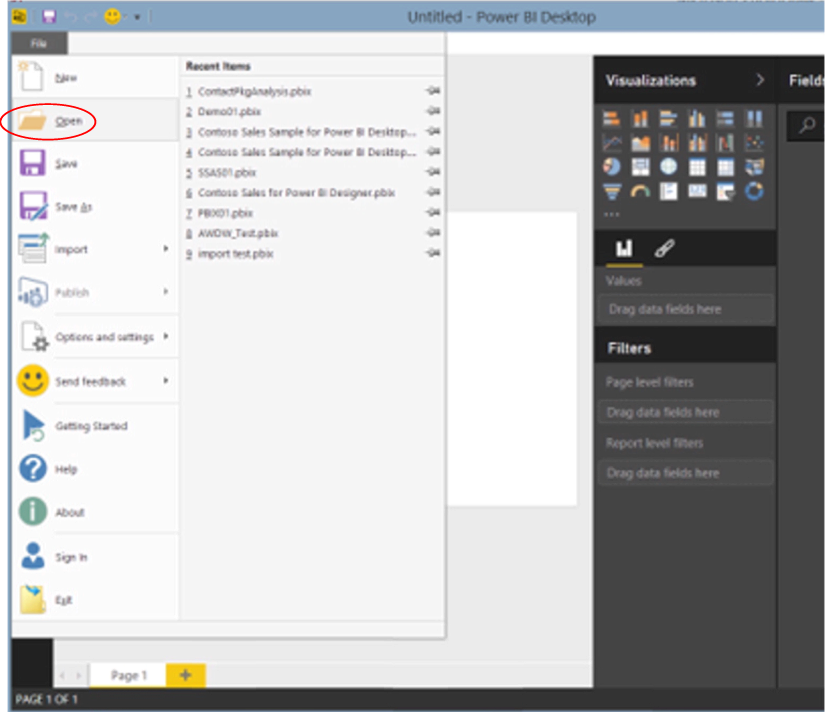 Illustration 2: Select File - Open in Power BI
 Illustration 3: Select the Sample File …
 Illustration 4: The Model Opens in Power BI Desktop …
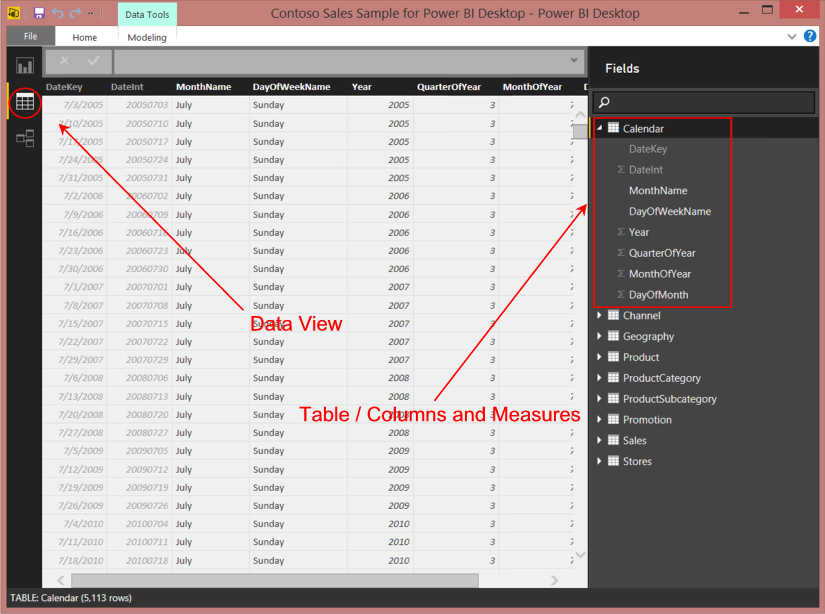 Illustration 5: Power BI Desktop Data View
The Concatenate() Function
Introduction
According to the Microsoft Developer Network (MSDN), the DAX Concatenate() function “joins two text strings into one text string.” Concatenate() is a member of the Text functions group, members of which support common needs to return part of a string, search for text within a string, concatenate string values and other such requirements.
Concatenate(), among many other DAX functions, is displayed as a selection in the Power BI Desktop Formula bar that appears when creating a new column or a new measure. The function is often used in combination with other DAX functions. The items joined via the Concatenate() function can be text, text representations of numbers or Boolean values, or combinations of these items. Column references are also allowed within Concatenate(), as long as the column contains values that the function accepts.
Unlike the Excel Concatenate() function, with which many of us are familiar, the DAX version of Concatenate() accepts only two arguments. Should the need arise to concatenate more than two items / columns, we can create a series of calculations, or use the Concatenate operator (“&”) to join multiple items in a straightforward, chained expression. We must enclose each string within double quotation marks (““) any time we seek to join text strings directly, rather than referencing columns.
We will explore the syntax for the Concatenate() function after a brief discussion in the next sections. We will then gain some hands-on exposure to its use, within a practice example constructed to support a hypothetical business need, in the Practice section later in this Level. This will allow us to activate what we explore in the Discussion and Syntax sections.
Discussion
To restate our initial explanation of its operation, the Concatenate() function simply joins two strings, which can include text or numbers. We can also use column references within the function. Column values with different data types can also be concatenated. If we attempt to concatenate a numeric value, the value will be implicitly converted to text. Even two numeric values placed into Concatenate() will be cast to text, and then concatenated as two strings. Concatenate() can be used with equal utility within Power BI columns or measures. Concatenate() can, like most DAX functions, be employed within other DAX functions.
Syntax
Syntactically, in using the Concatenate() function to join two strings (either text or numbers), we specify the strings to be joined within the parentheses to the right of the Concatenate keyword, as shown here:
=CONCATENATE(<text1>, <text2>)
As we have noted, we can also use column references within the function. The returned value is the concatenated string.
As an illustration, let’s take a look at a couple of simple uses of Concatenate(). First, to concatenate a couple of literal string values, we might create a string value in a new calculated column we add to the Stores table, as seen in the Data view of Power BI Desktop for the Contoso Sales Sample we imported in our earlier preparation. To do so, we would combine two string values we supply as arguments, within a column in the table:
Simple_Literals = CONCATENATE("Simple","Text")
Let’s say we’ve already employed Concatenate(), via a simple calculation called Simple_Literals, within the Stores table. The string value of “SimpleText” displays within the new column in the table in the Data view:
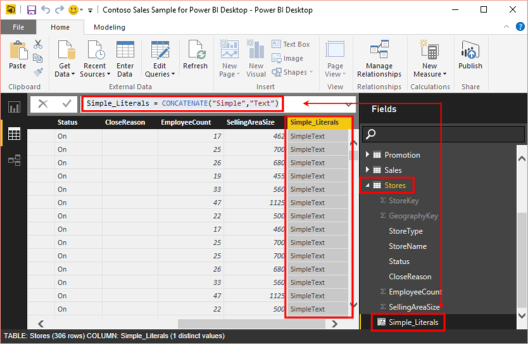
Illustration 7: Simple Example of the Concatenate() Function at Work
Reaching beyond the view we see above, where for the sake of an easy example we’re using the Concatenate() function to generate a simple, literal string combination, we can easily see how the calculation returns the desired outcome.
Let’s take another straightforward example: Let’s examine a concatenation of two strings that reside in separate columns: Say that a need exists that extends beyond the initial data imported into the Promotions table, also found within the Data view of Power BI Desktop for the Contoso Sales Sample we have imported during earlier preparation. The business requirement is to be able to display, together in the same field in various reports, the Promotion Label and Promotion Name (some information consumers know the Promotions very well by Label, while others know them by Name only, so this presents a basis for reporting and analysis that is equally comfortable for both groups of consumers.
To make this possible, a concatenation could easily be performed to combine the strings in the two columns, together with a spaced dash (“ - “) separator for easier reading, within a column (named simply “Promotion,” for more compact reporting) in the table:
Promotion = CONCATENATE(Promotion[PromotionLabel], CONCATENATE(" - ", Promotion[PromotionName]))
Again, we’ll say we’ve already employed Concatenate(), via a calculation named “Promotion,” within the Promotion table. The combined string value of the respective promotion labels / names display within the new column in the table in the Data view, as partially shown:
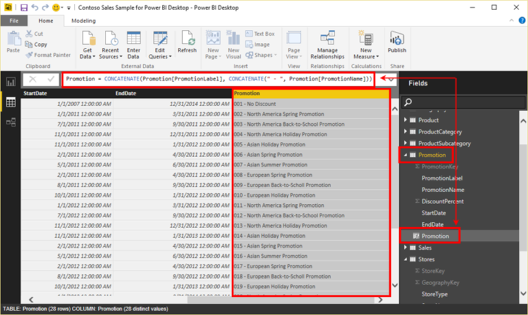
Illustration 8: Another Example of Concatenate() at Work (Partial View)
We’ll use a similar approach in the hands-on Practice section below, simply to enable easy verification of the accuracy of the results and so forth. Moreover, we’ll examine additional possibilities with Concatenate() in the sections that follow. Before we get to practice with Concatenate(), though, let’s introduce its “X” partner, ConcatenateX().
The ConcatenateX() Function
Introduction
According to the Microsoft Developer Network (MSDN), the DAX ConcatenateX() function “concatenates the result of an expression evaluated for each row in a table.” ConcatenateX() takes two arguments, the first of which must be a table, or any expression that returns a table. The second argument is a column, or an expression that evaluates to a column, containing the values that we want to concatenate. This enables us to generate delimited lists of “occurring combinations” that will prove particularly useful in market basket and similar analyses. ConcatenateX(), like other iterator (“X”) functions, and by its very nature, lends itself to use in combination with other DAX functions.
As we’ve noted in other Levels within the Function / Iterator Function Pairs subseries of the Stairway to DAX and Power BI series, iterator functions typically contain a table expression (the first parameter specified within the function), for which a calculation, based upon an expression specified by a second parameter, is performed iteratively for each row of the table. The ultimate result is generated by the application of the respective function (including SUM, AVERAGE, COUNT, MAX, and MIN, as well) to the dataset returned by the first and second expressions. We expose the behavior of other DAX “X” functions within independent examinations of each of the respective function / x-function pairs published in parallel to this review of the Concatenate() and ConcatenateX() functions.
ConcatenateX() is useful anytime we want to iterate over a list of values housed in a table and concatenate the specified values into a single value. We’ll briefly discuss the ConcatenateX() function in the section that follows, after which we will explore ConcatenateX() from a syntax perspective. We will then activate what we have explored in the Discussion and Syntax sections, through hands-on exposure to its use, within practice examples constructed to support hypothetical business needs.
Discussion
As we have discovered, the ConcatenateX() function iterates over a list of values in a specified table, and then concatenates those values together into a single value. Let’s look at some syntax illustrations to further clarify the operation of ConcatenateX().
Syntax
Syntactically, in using the ConcatenateX() function to return the result of an expression evaluated for each row in a table, we take a table expression (first argument of the function), and the expression (second argument of the function) that we seek to apply to each row of the table (specified in the first argument), within parentheses, to the right of the CONCATENATEX keyword. We can supply a delimiter, as well, but this is optional. The general syntax is shown in the following string:
CONCATENATEX(<table>, <expression>, [delimiter])
Putting ConcatenateX() (or any of the “X iterator” functions, for that matter) to work is intuitive, once we grasp the purpose. Using the above syntax structure, the ConcatenateX() function takes as its first argument a table, or an expression that returns a table. The second argument is a column that contains the values we want to concatenate, or an expression that returns a value. It’s easy to see how we might write a calculation that leverages ConcatenateX() to return a value when there is only a single value, or, in a case where there are multiple values, to concatenate all the values into a single value.
Let’s take a look at a simple example in Power BI Desktop, this time via a measure, together with the value that is ultimately delivered when we place that measure within a simple visualization. Let’s say we want to put ConcatenateX() to use in a straightforward scenario, within a measure called ProductCategoryList, that we create in the ProductCategory table of the Contoso sample:
ProductCategoryList =
     CONCATENATEX(ProductCategory, ProductCategory[ProductCategory],",")
Beginning in Data view, at the ProductCategory table, we see the measure in the Fields list, as shown.
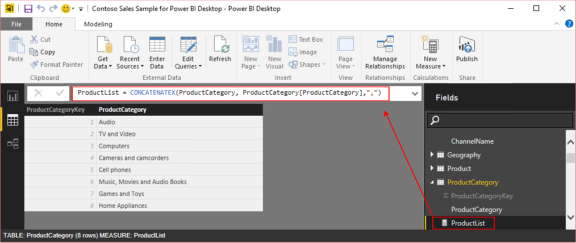
Illustration 9: ConcatenateX() at Work: ProductList Measure Generates a Concatenation of All Product Categories
When we add the measure to a Card visualization in the Report view, we get a concatenation of all the ProductCategory items appearing in the ProductCategory column of the ProductCategory table, as depicted:
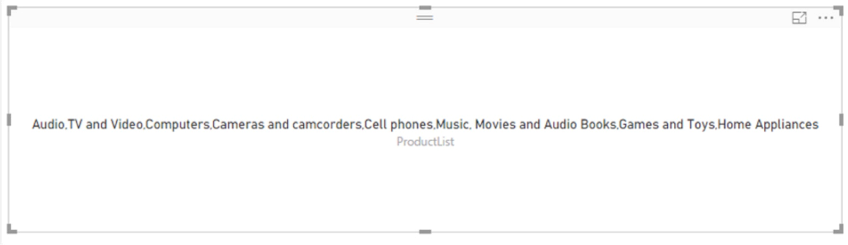
Illustration 10: Measure Containing ConcatenateX() Displayed in a Card Visualization
We’ll observe a slightly more sophisticated example in the Practice section below, where we’ll see ConcatenateX() used to a more practical purpose.
We’ll get some hands-on practice with Concatenate() and ConcatenateX() in the sections that follow.
Practice
Let’s next reinforce our understanding of the basics by putting the Concatenate() and ConcatenateX() functions to work within the step-by-step definition of some calculations. We’ll do this somewhat as we have in the other Levels of this Stairway series: First, we’ll work with Concatenate() via a column within the Data view of the model we have established, and then we’ll work with ConcatenateX() via a measure we create and then put to work within a straightforward visualization. The intent, as in all the practice sessions we undertake together within this series, is to demonstrate the operation of the functions we examine in an n easy-to-understand, memorable manner. We will turn to the Power BI Desktop model we prepared earlier as a platform from which to construct and execute the DAX we examine, and to view the results we obtain.
Add a New Column in the Data View
We’ll begin, as noted, with a straightforward example: We’ll reconstruct the Promotion column we previewed earlier (see Illustration 8). Recall that this is merely an attempt to illustrate how Concatenate() works with two columns containing strings, and placing a dash mark (“ – “) between these columns to create a label for use in various reports. This is an example of concatenating multiple strings, via nesting, where more than two arguments are involved. We will look at an alternative way of achieving similar ends as a second example.
To recreate the Promotion column, we will take the following steps:
- Return to the Data view.
- Click the Promotion table in the Fields list on the right side of the Data view to expose the table’s columns.
- With the Promotion table selected, click the New Column button on the Modeling tab of the ribbon, as shown.
Illustration 11: Creating a New Column in the Promotion Table …
The placeholder name of “Column” appears in the Formula bar, and among the Promotion table columns, as depicted.
Illustration 12: The Column Placeholder Appears …
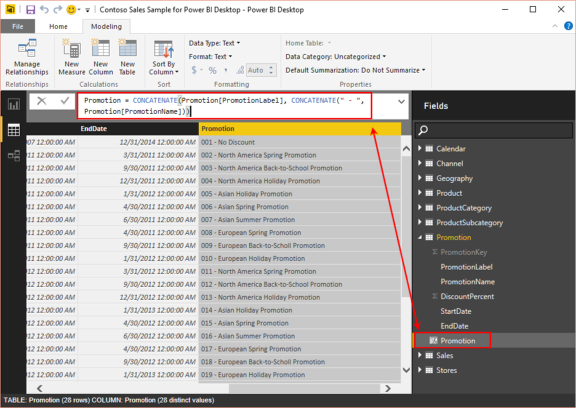
- Type the following DAX into the Formula bar, replacing the “Column = “placeholder:
Promotion = CONCATENATE(Promotion[PromotionLabel], CONCATENATE(" - ", Promotion[PromotionName])) - Press the ENTER key.The new Promotion column replaces the placeholder in the Fields list and the column is populated in the Data view, as partially shown.
Illustration 13: The Promotion Column is Populated (Partial View)
The expected result, the concatenation of the Promotion Label, a dash surrounded by single spaces (“ – “), and the Promotion Name populates the new Promotion column.
Note that we had to nest a Concatenate() function within another Concatenate() function to concatenate more than two arguments. (This is the behavior we mentioned earlier that differs from that of the Excel Concatenate() function, which accepts up to 255 arguments.) We can, however, bypass the nesting process by using the concatenation operator (“&”), as we’ll see in the steps that follow.
- From inside the Data view, once again, select the Promotion table.
- Click the New Column button on the ribbon, as we did in the immediately preceding example.
- Type the following DAX into the Formula bar, replacing, as before, the “Column = “placeholder:
PromotionLife = Promotion[StartDate] & " - " & Promotion[EndDate]
- Press the ENTER key.The new PromotionLife column replaces the placeholder in the Fields list and the column is populated in the Data view, as partially depicted.
Illustration 14: The PromotionLife Column is Populated (Partial View)
The expected result, the concatenation of the promotion Start Date and End Date, separated by a dash surrounded by single spaces (“ – “), populates the new PromotionLife column. As is obvious, the concatenation operator (“&”) can make scripting simpler by alleviating the need to nest concatenations. (As an aside, I have noted no significant difference in performance when using the operator versus the Concatenate() function.)
We’ve created a couple of columns that perform concatenation within the Data view. We could, of course, pull these into other calculations, or into visualizations within the Report view. We will gain some exposure to these approaches, with different calculations within measures we create in the Report view, in the next section.
Next, let’s put the ConcatenateX() function to work. As a part of demonstrating its operation, within a somewhat more practical business use, we’ll work with the function in the Report view, introducing both Slicer and Card visualizations.


Putting Simple Business Solutions Together in the Report View
Let’s first employ ConcatenateX() within a straightforward example: Let’s say that our client, the Contoso organization, has asked us for a simple text-list of their product categories. This is mainly to demonstrate how we can use ConcatenateX() to create a list within a Card visualization, which will work more satisfactorily to deliver delimited lists than other visualization options.
To meet the client requirements, let’s take the following steps:
- Click the Report view icon in the left navigation bar, as shown.
Illustration 15: Go to the Report View in Power BI Desktop …
We are greeted with a blank canvas. Here we will pull in the Card visualization needed to meet the requirements we will obtain with the Contoso Product Category data. Let’s assemble a simple Card report, containing the basic Product Category data values.
- Click the Card visualization within the Visualizations pane.An empty Card visualization appears on the canvas.
Illustration 16: Launch a Card Visualization on the Canvas (Composite Image)
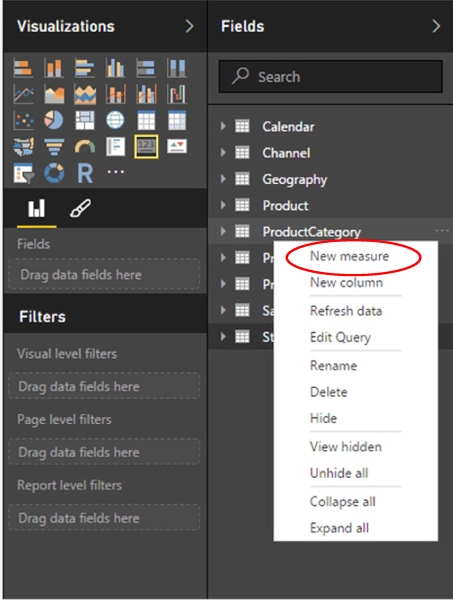
- In the Fields list on the right of the desktop, right-click the ProductCategory table.
- Select New Measure from the context menu that appears, as shown.
Illustration 17: Select New Measure …
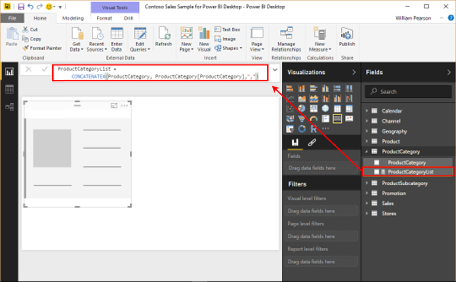
- Type the following into the Formula bar of the Data view:
ProductCategoryList =
     CONCATENATEX(ProductCategory, ProductCategory[ProductCategory],",")
The measure definition appears in the Formula bar of the Report view as depicted:
Illustration 18: Measure Using ConcatentateX()
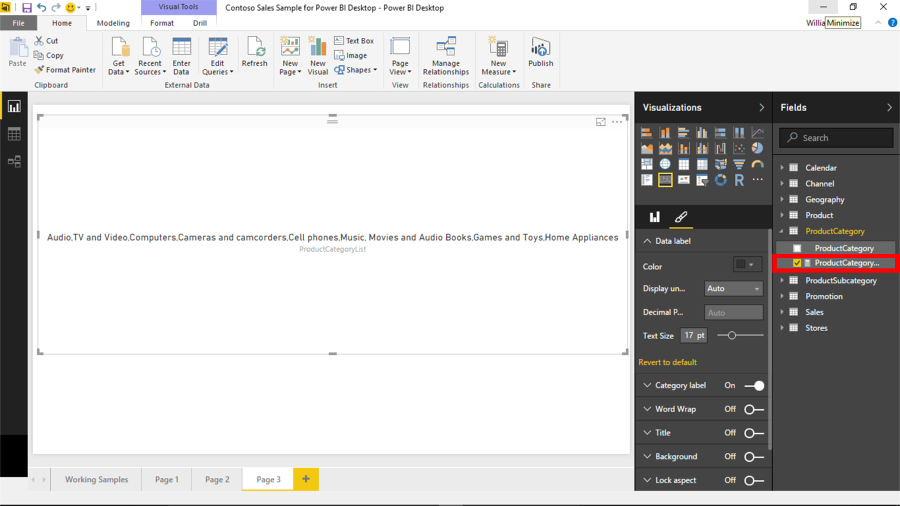
- Click the checkmark icon to the left of the Formula bar to syntax check, and enter / save the new measure.We see the new measure created – conveniently within the Report view.
- Ensuring that the Card visualization is selected on the canvas, click the check box to the immediate left of the new ProductCategoryList measure in the Fields pane.The concatenated Product Category list appears, as expected, on the Card, as shown.
Illustration 19: Concatenated List Appears on the Card Visualization (Font Adjusted to Fit Card Region)
Let’s look at another example of a simple use of the ConcatenateX() function, again in the Report view of our model. Let’s say that our colleagues within the Contoso organization, have asked us for an additional, simple text-list, this time providing the Brand Names (“BrandName” in the Product table) that are offered within each of the three product Classes (“ClassName” in the Product table) – in other words, a list of the Brand / manufacturer members of each of the Economy, Regular and Deluxe Class groupings. They want to call this grouping, which we will generate via a calculated measure, ClassVendors.
Our colleagues indicate that they would like to be able to select which ClassVendor member list(s) to generate at any given time, a capability that we expect to be deliver with a Slicer visualization in the Power BI Report view.
To meet the client requirements, let’s take the following steps:
- Return to the Report view in Power BI, if necessary.
- Open a blank canvas via the “+” button underneath the existing canvas.
Illustration 20: Create a New Canvas in Power BI
We are greeted with a blank canvas. Here we will pull in the two visualizations we need to meet the requirements our colleagues have specified. Let’s start with a simple Card report, as we did in our earlier practice exercise, within which we will project the results of a calculation we will create simultaneously – a calculation that, this time, will focus upon the Product Brand Names associated with three classes into which they are grouped.
- Click the Card visualization within the Visualizations pane.An empty Card visualization appears on the canvas.
- In the Fields list on the right of the desktop, right-click the Product table.
- Select New Measure from the context menu that appears, again as we did in the previous exercise.
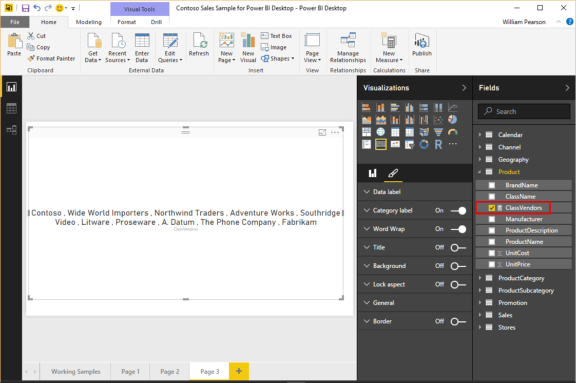
- Type the following into the Formula bar of the Data view:
ClassVendors =
CONCATENATEX(
    VALUES(Product[BrandName]),
    Product[BrandName],
    " , "
)
The measure definition appears in the Formula bar of the Report view as depicted:
Illustration 21: Another Measure Using ConcatentateX()
- Click the checkmark icon to the left of the Formula bar to syntax check, and enter / save the new measure.We see the new measure created – again, having completed all steps involved conveniently within the Report view.
- Ensuring, once again, that the Card visualization is selected on the canvas, click the check box to the immediate left of the new ClassVendors measure in the Fields pane.The concatenated Class Vendors list appears on the Card, overrunning the borders of the visualization.
- This time, turn on Word Wrap by clicking the Format button, underneath the Visualizations collection group atop the Visualizations pane, and then clicking to the right of the exposed Word Wrap slider switch to move it to the “On” position, as shown.
Illustration 22: Turning the Word Wrap Slider Switch to “On”
The concatenated Class Vendors list appears, this time with wrapping to fit the borders of the Card.
Illustration 23: Class Vendors List Appears, with Wrapping, within the Card
Now that we have the ClassVendors list generated, enumerating the Brand Names for all Classes, let’s add the capability for information consumers to specify the class(es) for which they want the respective members reflected.
- Click a blank area on the canvas.
- Click the Slicer visualization within the Visualizations pane.An empty Slicer visualization appears on the canvas, as depicted.
Illustration 24: Create a Slicer Visualization on the Canvas (Composite Image)
- Slide the Slicer to the left side of the Card we created earlier, somewhat as shown:
Illustration 25: Arranging the Slicer and Card Visualizations on the Canvas …
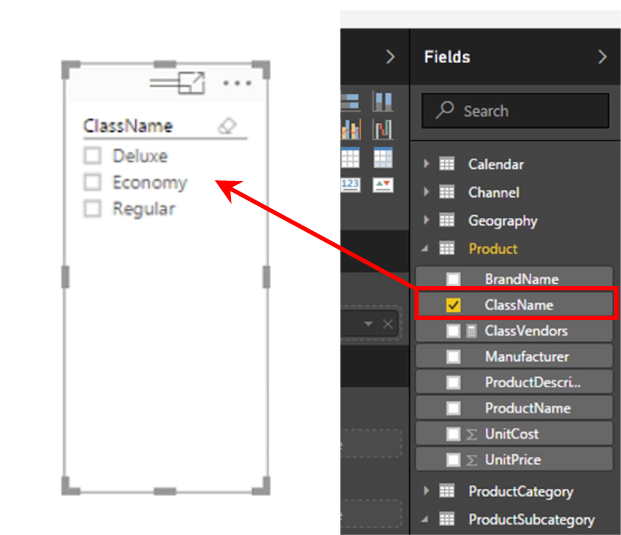
- Ensuring that the Slicer visualization is selected on the canvas, click the check box to the immediate left of the new ClassName column in the Fields pane.
Illustration 26: “Selecting the Selection Criteria” for the Slicer (Composite Illustration)
We now have a way to narrow down our list. Let’s test out the effect of using the Slicer.
- Select the Deluxe class in the Slicer by clicking the checkbox to its immediate left.A concatenated list of the manufacturers / brands supplying Deluxe-class products appears in the adjacent Card visualization, as depicted
Illustration 27: Selecting the Smaller Deluxe Class Concatenated List, Via the Slicer …
The number of members of the ClassVendors appearing in the Card decreases when we slice by Deluxe; we can easily verify that fewer manufacturers supply Deluxe products by scanning the underlying table. This simple example illustrates a way to meet the client requirement; we could do far more elaborate slices, of course, across the data model with the powerful Power BI / DAX combination. Moreover, while we chose to work here with “all time” in the model, we might have easily analyzed and reported upon data based upon date ranges, among other criteria, and created conditions (from simple to complex) that further refined the data, and / or included data taken from multiple tables. As we’ve repeatedly noted throughout this series, it is easy to see how DAX empowers us to generate and support comprehensive BI within our Excel environments, transforming the relatively limited options we once had with simple spreadsheets into sophisticated and robust reporting and analysis solutions.


Summary …
In this Level of the Stairway to DAX and Power BI series, we explored the DAX Concatenate() and ConcatenateX() functions. We discussed the general purposes, syntax and operation of each of these two DAX functions, and then focused upon using each in general. We also compared and contrasted ways that each can be employed, noting that we can combine them with other functions to achieve results like those we might need to deliver in client or employer environments.
In like manner to our standard approach to every DAX function we explore within the Stairway to DAX and Power BI series, we undertook illustrative examples of the uses of Concatenate() and ConcatenateX() in practice exercises, and then observed the results datasets we obtained. We extended our exploration of Concatenate() and ConcatenateX() to the delivery of illustrative answers to business questions, within both the data model and visualization levels of Power BI. In accordance with another objective of the series, we exposed practical examples of features of Power BI as a platform for employing DAX in our data models and visualizations to meet representative sample business requirements.
