

Today I will show to you what I think is one of the most exciting new feature of SQL Server 2008 R2: the PowerPivot – it is indeed an awesome “Power” to have in SQL Server 2008 R2.

PowerPivot for Excel 2010 (formerly known as ‘Project Gemini’) is the complete name of this new feature, and its grand promise is the advent of self-service Business Intelligence. In other words, it has powerful analysis capabilities, is very easy to use, enables you to very quickly and easily get exactly the data what you want to apply those analysis capabilities to.
“Ok Thiago, this name means that we have to use Excel 2010. Why?”
Because Excel is the most commonly-used and familiar interface for those people that make business decisions. PowerPivot is also more versatile than simple using a dynamic table with an SSAS cube, because it’s possible to integrate a large amount of data from virtually any source with a minimum of hassle, and then share the generated analysis through integration with SharePoint 2010. PowerPivot also has its own formula language, known as DAX (Data Analysis eXpressions), which is similar to Excel’s native formula language but comes with more capabilities. For example, DAX expressions let you add calculated columns to your PowerPivot and calculated fields to your individual pivots. DAX gives us some pretty neat functionality, and I’ll definitely cover it in my later, more advanced articles.
In this article, I’m going to cover the basics of getting started with PowerPivot. I’ll take you through what you need to start using it, how it integrates with Excel 2010, and how to load and manipulate a sample dataset. There are a lot of additional powerful features which I’ll mention in passing, but they’ll be covered at a later date. In my next article I’ll cover the next step of distributing your analyses via SharePoint 2010, so be sure to come back for that and other more advanced tips!
What Do I Need to Start?
Everything you’ll need is already publicly available - the SQL Server 2008 R2 November Community Technical Preview (CTP), the Microsoft Office 2010 Beta and the PowerPivot plugin for Excel 2010. Follow these links to get your ’magic’ ingredients:
- Microsoft SQL Server 2008 R2 (Nov CTP):
http://www.microsoft.com/sqlserver/2008/en/us/R2.aspx - Microsoft Office 2010 Beta:
http://www.microsoft.com/office/2010/en/default.aspx - PowerPivot for Excel (make sure to download the plugin for the right platform, depending on your version of Microsoft Office 2010):
http://powerpivot.com/download.aspx
Install Microsoft Office 2010, SQL Server 2008 R2 and then PowerPivot for Excel. If you’re unsure about anything, the official PowerPivot website also provides a guide to installation.
Since PowerPivot is all about analyzing data, you’ll need some data do work with. You’ll see that we can use a huge number of different data sources, such as Excel worksheets, SQL Server, Oracle and so on. You can find some sample databases to play with here, and for the purposes of this article we will use the following database (save this to an appropriate location on your hard-drive). Ok, now that we have everything installed, we can start the fun!
First Impressions
The first thing you should notice is the new tab in Excel (as shown in the Figure 1):
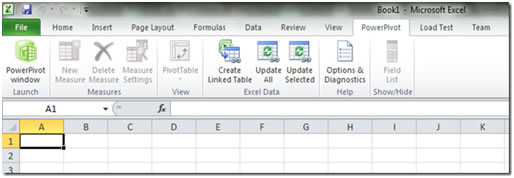
Figure 1: The new tab in the Microsoft Excel 2010.
In this tab we have six groups: Launch, Measures, View, Excel Data, Help and Show/Hide. We’ll start with the Launch group, which opens the PowerPivot window as seen in Figure 2. The other groups on the tab will be covered in the next article, when I’ll show you some more advanced features. For the purposes of this article, we won’t need them.
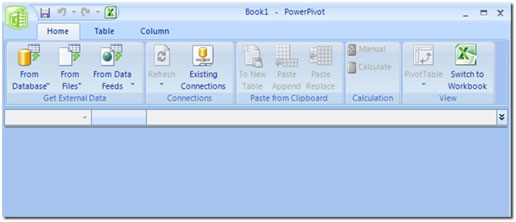
Figure 2: The PowerPivot Window
Of course, assuming it’s the first time that you’ve used the feature, the PowerPivot window will be empty because you don’t any have data yet. What we have enabled are the buttons to get data, to list and configure the existing connections, and to switch back to the workbook (the last of which can also be achieved by clicking on the excel icon over the Table tab).
Before we import some date to demonstrate, let’s see the different data sources that we can use. When you initially click on ‘From Database’, you’ll see the most common data sources, but you can then click on ’From Other Sources’ to see more options.
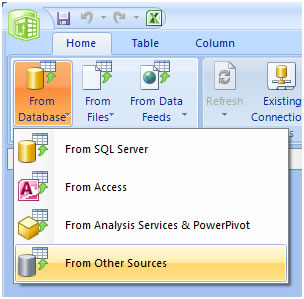
Figure 3: The ‘From Other Sources’ option
The sources that are available in the November CTP are:
- Microsoft SQL Server
- Microsoft SQL Azure
- Microsoft Access
- Microsoft SQL Server Analysis Services
- PowerPivot workbooks published to Analysis Services running in SharePoint Integrated Mode (this one is a bit of a mouthful)
- Oracle
- Teradata
- Sybase
- Informix
- DB2
- DataFeeds
- Excel workbooks
- Text files
You can also use OLEDB and ODBC connections
In my opinion, the ability to use information from SSAS and combine it other sources is fantastic, and we’ll see some of that in a future article. This capability is, quite simply, dozens of times more powerful than just using a dynamic table with a SSAS cube, as it extends the analysis capability and lets the PowerPivot user view consolidated information (which can be more interesting than just looking the sources separately).
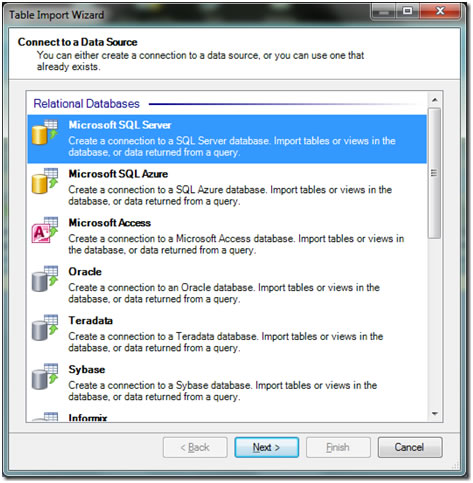
Figure 4: The available data sources.
Sample Data Source
The sample data source that we will use contains four files:
- AccessQuery.txt - this contains the query that we will use in the first sample.
- AW_Companysales.accdb and IndustryBikeSales.accdb, which are sample Access Databases.
- Country.xlsx, containing the correlation between the name and the country code.
In the ‘Get External Data’ group on the ribbon, click on ’From Database’, select ’From Access’, and then select the IndustryBikeSales database. It comes complete with a friendly connection name, and does not need a login or password, so leave those fields empty.
In the next window (Figure 5), select the option that will let you write a custom SQL statement. Input the following query, and click on the finish button to import the data, and the results window should look like Figure 6.
SELECT IndustrySales.Country, IndustrySales.Quarter,
IndustrySales.[Type Of Bike], IndustrySales.Channel,
IndustrySales.Units
FROM IndustrySales
WHERE ( (IndustrySales.Quarter >='2001 Q3')
AND (IndustrySales.Quarter<='2009 Q2') )
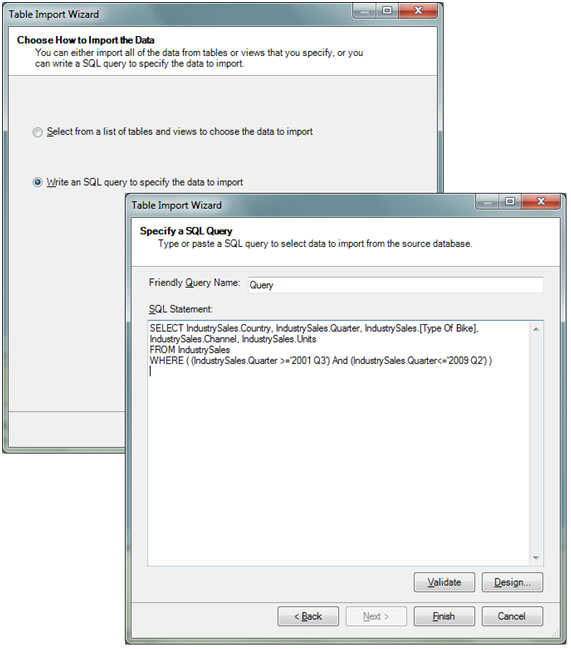
Figure 5: Choose How to Import the Data

Figure 6: The Import Window
Your PowerPivot window will then look similar to Figure 7.
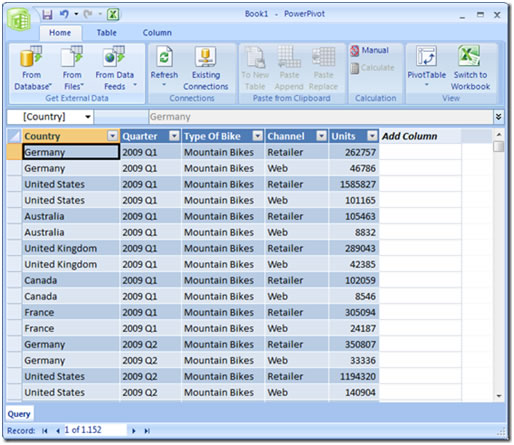
Figure 7: IndustryBikeSales data
PowerPivoting the data!
We now have information about bike sales by quarter, divided by type and by sales channel, and you have to admit that it is quite difficult to analyze these rows as they currently stand. Wouldn’t it be wonderful if we could just organize the total amount of sales by type, country or quarter in a fast way with a few clicks?
That’s exactly what we can do in PowerPivot for Excel, and so with minimal effort we can extract maximum information. Given that this is a tool inside Excel, you can also add new columns based on Excel formulas to do more extended analysis (thought I won’t be able to cover that today)
You may have noticed in Figure 7 that we actually have some more buttons enabled now that we’ve got some data: ‘Refresh’, ‘Manual’ and ‘PivotTable’. The ‘Refresh’ button re-imports the data from the sources, just like any other refresh button. You should use the ‘Manual’ button when you have calculated columns and don’t want automatic calculation to occur, because it can cause performance problems (Once you’ve activated the Manual mode, you can deactivate it by simple clicking on it). The ‘Calculate’ button is only available when you are in Manual mode; once clicked, the selected columns will be calculated in the PowerPivot window. The PivotTable button is the one that you need to look at more closely at the moment; clicking on it will show you an extended menu:
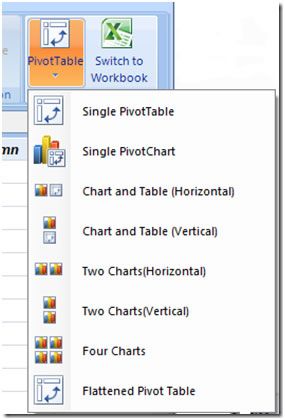
Figure 8: The PivotTable Menu
When you select one of these items, Excel will ask you where you want PowerPivot to create the template (in a new worksheet or an existing worksheet); whichever you choose, PowerPivot will create the template, and Excel will look like Figure 9 (for my example I’ve selected the Four Charts option).
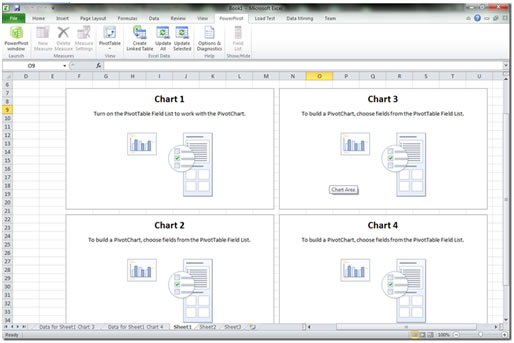
Figure 9: The charts template generated by PowerPivot
I opted to add the template to the existing ‘Sheet 1’ workbook, and there is something that the more sharp-eyed amongst you may have noticed: we have four more worksheets than we started with (‘Data for Sheet 1 Chart 1’, ‘Data for Sheet 1 Chart 2’, and so on), although for now we’ll just focus on the charts in Sheet 1. When you click on one of these charts, you’ll see the Pivot Chart Tools group appears on the ribbon bar, as well as the Gemini Task Pane (at the right-hand side of screen). I won’t get into details about the ribbon, as most of the options are for formatting, and there’s nothing particularly new or interesting there.
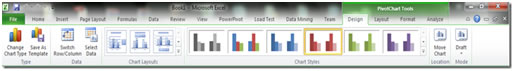
Figure 10: The PivotChart Tools: Design
Does the Gemini Task Pane look familiar to you? It’s actually very similar to the Excel Dynamic Table Pane, but with new addition of ‘slicers’ (we will see what they do in a moment).
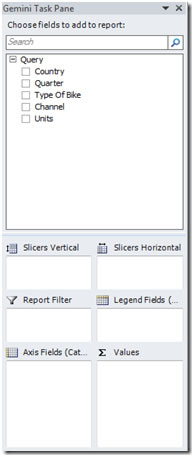
Figure 11: The Gemini Task Pane
Now we’ll select some data to populate the charts. Using the Task Pane, you can use the checkboxes by the data fields, or you can drag and drop the fields into the desired place at the bottom of the Pane: Legend fields, Axis fields, Values or filters (as you can see in Figure 11). You can also use the new ‘Slicers’, which are essentially like filters which can be connected to multiple pivot tables, and which you can turn on or off with just a click! Don’t forget that PowerPivot for Excel is designed to be used by the ‘decisions makers’, for whom Excel is a native environment, so this slick and easy behavior is very handy.
Click on the first chart (the top-left one), drag-&–drop the Country and Quarter columns from the Gemini Task Pane to the Slicers Vertical region. Then click on the Type of Bike and Units checkboxes, and your Gemini Task Pane will look like Figure 12. For the other charts you now just need to mark the desired check boxes…
- Chart 2: select Country and Units Columns,
- Chart 3: select Quarter and Units columns, and finally…
- Chart 4: select Channel and Units columns.
To change the chart type, you only have to select the Design tab and click on Change the Chart Type.
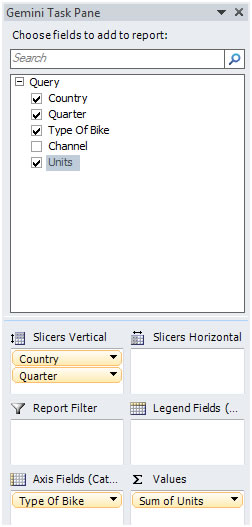
Figure 12: The Gemini Task Pane for the first chart
After you’ve had a play around with the data, and after quickly adding some columns to the charts and vertical slicers (with really very few clicks), You’ll have something like figure 13.
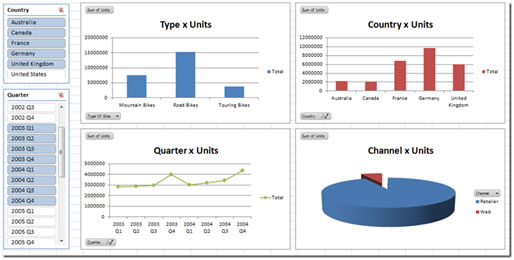
Figure 13: Dashboard about my data that was created with a minimal number of mouse clicks.
If you look to the left side of figure 13, you’ll see the slicers in action. As you can see, I very easily selected only information from 2003 and 2004, and excluded the United States from my dataset. If I now wanted to analyze just Germany and the United States for the period of 2005, I would just need to mark those items in the slicers panels, and I’ll get precisely the information I wanted. As an aside, I also have to say that those operations are incredibly fast, even though the data source has millions of data rows.
The last thing that you should take a look at now is in the extra worksheets that were created by PowerPivot. The data there should look familiar, as the information being displayed in the charts is stored on these sheets. If you want to, you can also edit the information that is contained there.
Conclusion
As you can see, it is incredibly easy to get started with PowerPivot and to very quickly get concrete, useful results. In just a few clicks (and fewer minutes) you can import data from just about any conceivable source, filter it, visualize it and analyze it. PowerPivot a very slick addition to SQL Server 2008 R2, and also makes excellent use of the powerful features inherent in Excel 2010! The next step is going to be to share the information with your colleagues using PowerPivot for SharePoint integration, which I’ll be demonstrating along with other advanced features (multiple data sources working together, etc) in the next article. Stay tuned!


