

I'm going now to continue from my first article "A neural Network in SQL Server - case study" where I showed the resulting data after I programmed a neural network (NN) in SQL Server. If you go back there, you might remember that I discovered that I needed first to better understand what variables of the data set were important for the prediction of rain for the next day, so I created a decision tree in Analysis Services and it gave me the idea of what variables to use for the input in the SQL neural network. Later, I also compared the results with the NN created in Analysis Services using the same data source.
In this article I will show you the process to create both, a decision tree and a neural network in Analysis Services, how to understand the information you'll get from them, and how to use it to make decisions or understand the meaning of your data.
What is a decision tree?
Decision trees (DS) are made of classification algorithms that produce human-readable descriptions of trends in the underlying relationships of a dataset and can be used for classification and prediction tasks. When making a decision based upon certain information, a decision tree can help identify which factors to consider and how each factor has historically been associated with different outcomes of said decision.
Creating a decision tree with Analysis Services
First of all, to use Analysis services to create a DS, we need to create a project (if we don't already have one created) within the Business Intelligence Management Studio environment. The project has to be an Analysis Services Project as it's shown in the below figure.
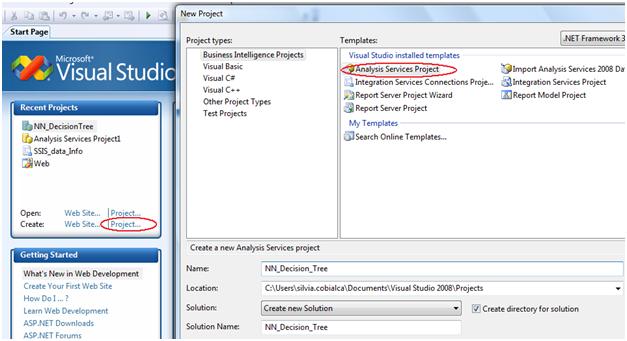
Lets name the project NN_Decision tree, and save it to a physical location in the disk.
Within the project, we now need to create a data source that will allow Analysis Services to connect to the tables we're using as data sets. So right clicking on Data Sources in the solution explorer (at the left pane), we'll select New Data Source option (see screen caption below)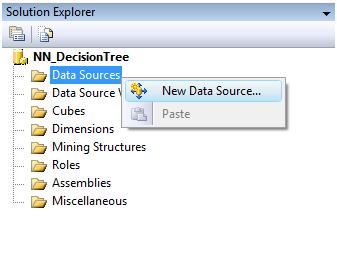
The data source wizard will guide us through the creation of the new data source: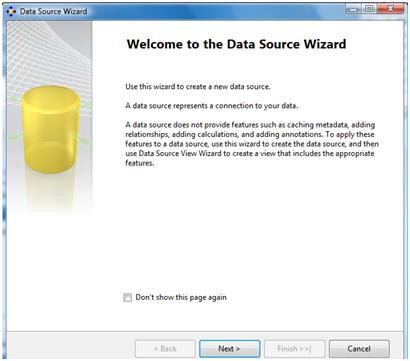
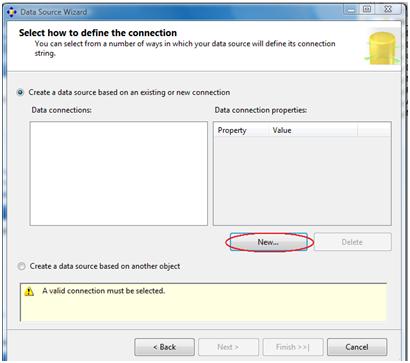
We need to define a new connection
And select the server name we're going to connect to, providing an authentication method and if we choose SQL Server authentication, we'll need to provide username and password.
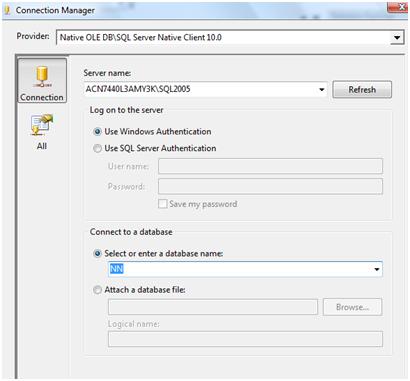
Once authenticated by the server we'll choose the database where we are going to be working, in this case, the NN database that has the weather data set of my first article.
Here we could also be using a different provider, for example excel, if our data set were in an excel spreadsheet and then we'd have been asked to select the sheet within that spreadsheet instead of the database name.
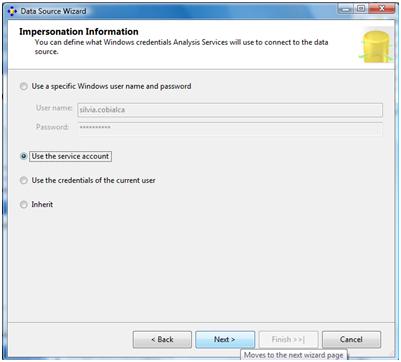
The next picture shows the impersonation information, this is the way Analysis Services will connect to the database server while trying to reach the data in it. It will be the account Analysis Services will be using to login so it's very important to setup this correctly or we'll be getting connectivity errors and won't be able to reach the data.
Below you can see how the data source was properly configured and named NN.ds.
The next step should be to choose the actual data set, as at this point we only are able to reach out to the database but haven't chosen the actual data table
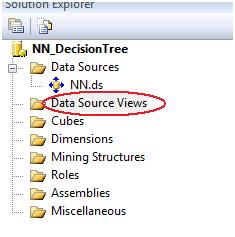
So for that, we right click on Data Source Views in the solution Explorer and we're lead to the Data Source Views Wizard.
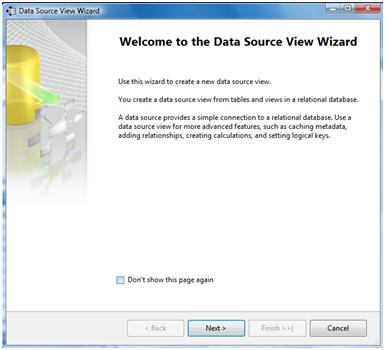
Clicking Next we'll see all the tables we have in the database. We need to select the table we're interested in and click the > button.

Next step is to provide a name for the new data source view
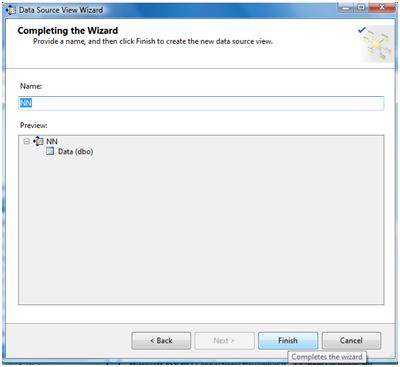
And we're done (see below NN.dsv created).
Now onto the part we're more interested in, which is the mining structure where we'll find the decision trees among others.
Right clicking in Mining Structures, select new Mining Structure from the context menu.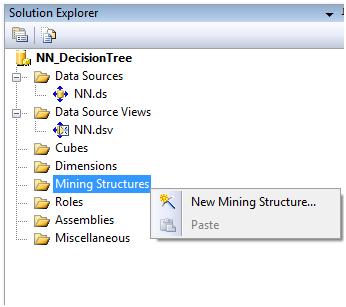
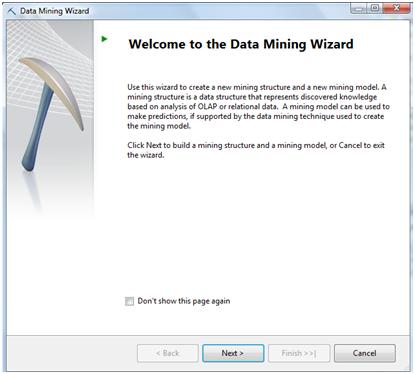
The wizard will guide us through the different steps to create the decision tree:
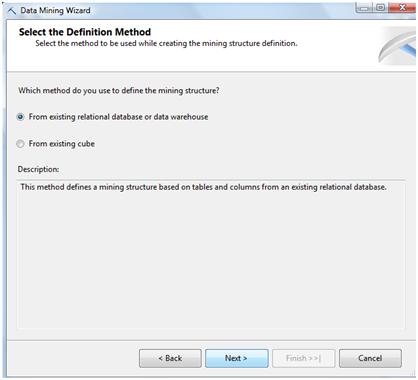
As we're going to use the data already configured as a data view, lets just click on the first option and then click Next.
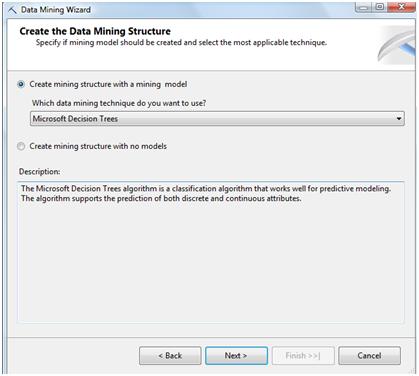
In the following screen you'll see the different algorithms supported by Analysis Services, in this case we'll chose Decision Trees and click Next.
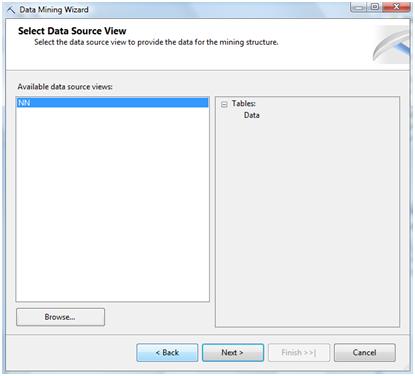
We now have to select the data source view previously created
In the next screen shows the variables in the tables. It's important to have a primary key variable and to check it in the KEY column on the right.
There's also another important variable that we'll need to distinguish among the rest of them. That is the predicted variable which is the one the decision tree will try to predict by using the others and with the help of the primary key.
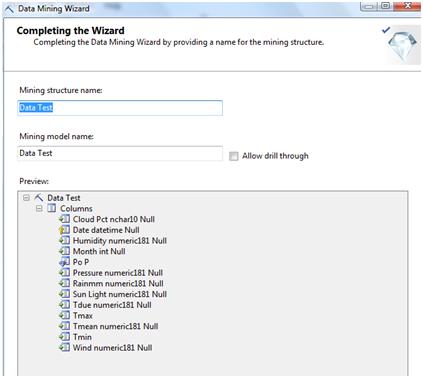
For example, in the case of the weather data I was using, I had, as you can see below, I have atmospheric pressure, humidity, cloudPct (percent of sky covered in clouds), different values of temperature (max, min, due and mean), wind, etc. All of these variables may affect or not if tomorrow will rain, and that's what we'll get to understand according to the outcome of the decision tree: which variables are important to take into account and how.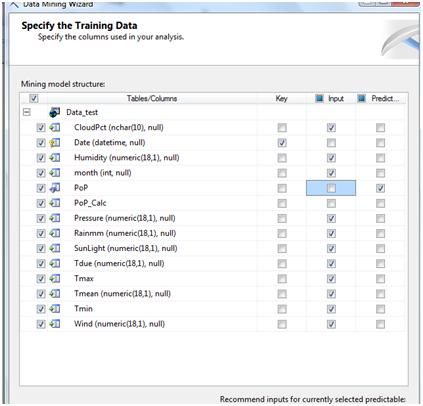
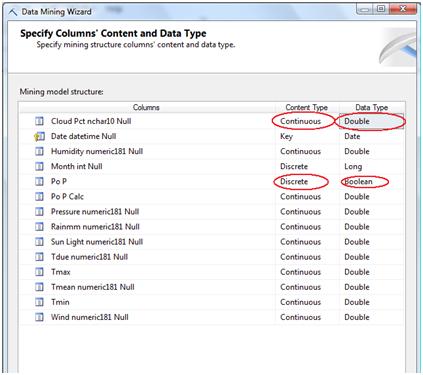
Another important fact is the variable type, it has to be setup right or the algorithm will not work fine. Also, the prediction variable must be discrete (usually a Boolean yes/no, or 1/0 value, or a variable that can only take on a finite number of values).
In the last step we set what percentage of the data set will be used for testing and which for learning.
The algorithm usually learns from a portion of the historic data, how the data behaves and builds patterns with it. After that, it tests the results in the portion of data reserved for testing.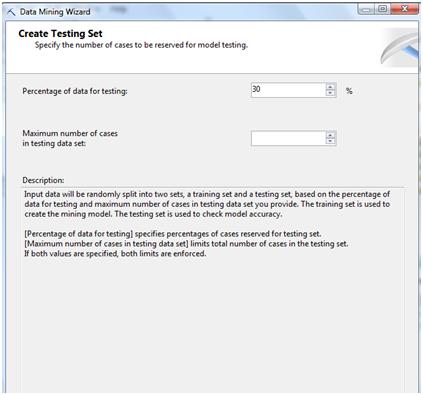
When saving the Decision Tree, we can notice the prediction variable and the primary have both distinctive icons showing their function in the mining structure created. Once finished the configuration steps, lets save the mining structure.
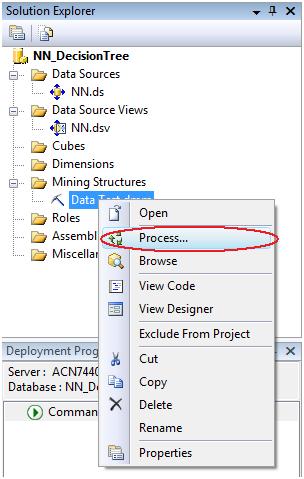
The next thing to do with our new mining structure if we want to see the results is to process it.
Analyzing the results
Mining Model Viewer
After processing the tree we want to see the results. There are different ways to analyze the data provided by the model as you can see in the different tabs below: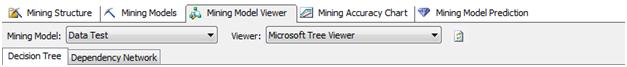
First of all, and to have a clear picture of the tree, we can go to the Mining Model Viewer tab:
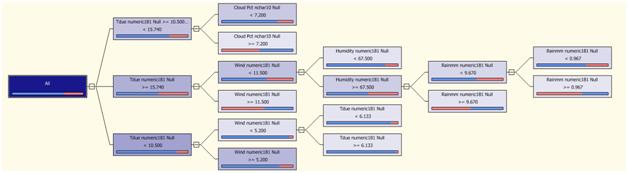
This is the same decision tree we saw in my previous article when I was trying to figure out which variables to use in my neural network to help me predict the Probability or precipitation (PoP).
In the tree view you can see that the variables to predict rain according to this data set are tempdue, cloudPct, wind, humidity and Rainmm. Going through the tree starting from the root, you'll find the different ranges that help splitting the data into the different values of the predicted variable.
If you take a row out of the data set and follow the tree structure you'll be able to see how the tree works.
For example, for the following row of data:
date: 2003-01-01
month: 1
Tmax: 25.6
Tmin: 18.4
Tmean: 21.4
Tdue: 16.9
Wind: 8.0
CloudPct: 5
Pressure: 1012.2
Humidity: 76.0
SunLight:7.2
Rainmm: 0.0
Pop: 0.0
According to Tdue=16.9, wind=8.0, Humidity=76% and Rainmm=0 it will travel the tree nodes as shown below:
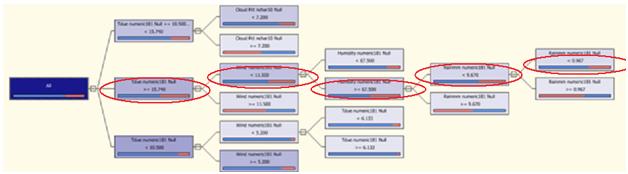
According to this, the present row of data would be one of those "True Negative" values we were seeing in my previous article, (because the PoP=0 and the node where it falls is a high percent negative node).
As a result it will get in a node with 68.7% probability of rain=false, which is right in the case of our data row (PoP=0)
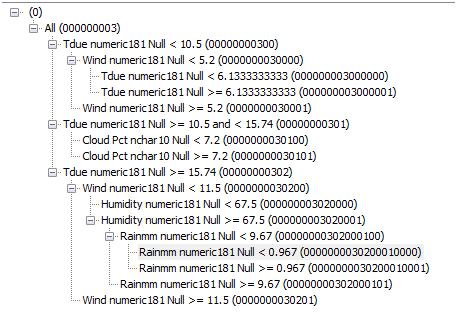
In the mining model viewer we can also get a different view by selecting "Microsoft Generic Content View" instead of selecting "Microsoft Tree viewer", and we'll see how the nodes are split and what is the description of the rull in each node. The following picture shows the left panel of the viewer where you can see all the nodes description and the node IDs:
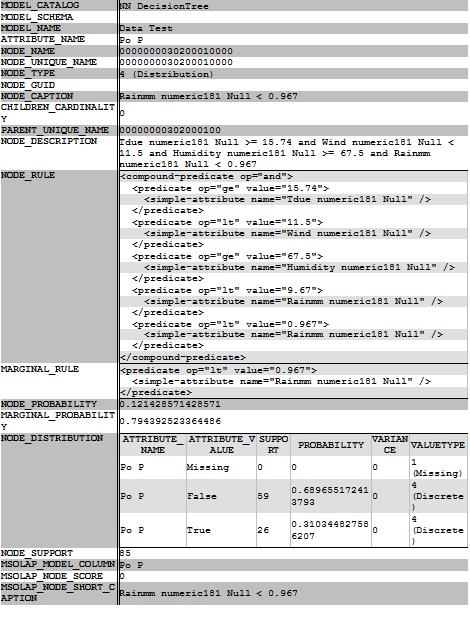
And below is the description of the last node (ID 0000000030200010000) corresponding to the row we got in when travelling the tree with the data row we used as an example:
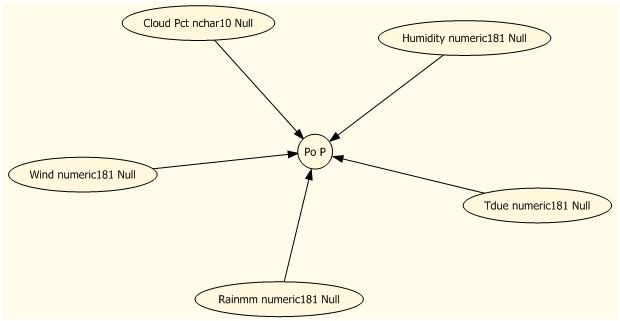
The dependency network shows which variables are important in the prediction
Mining Models
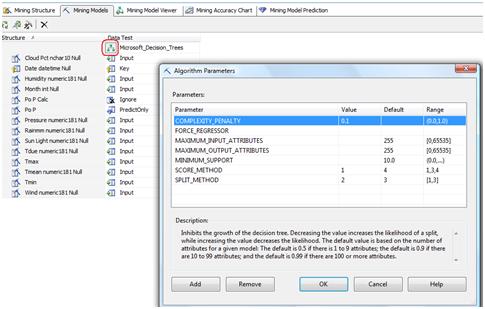
In the mining model tab we can change the parameters of the decision tree algorithm for example, the way it will split the nodes (if in a binary way or in a full way) or how the tree will grow.
Mining Accuracy Chart
In the mining accuracy chart tab there are several different sub-tabs to further analyze the results:

In the input selection we can select different models we have previously setup to compare them later, for example using the lift chart.
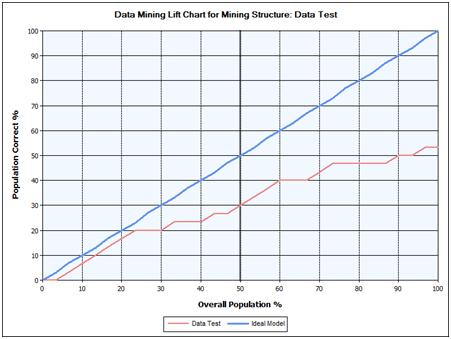
A lift chart compares the accuracy of the predictions of each model, and can be configured to show accuracy for predictions in general, or for predictions of a specific value. The x-axis of the chart represents the percentage of the test dataset that is used to compare the predictions. The y-axis of the chart represents the percentage of predicted values.
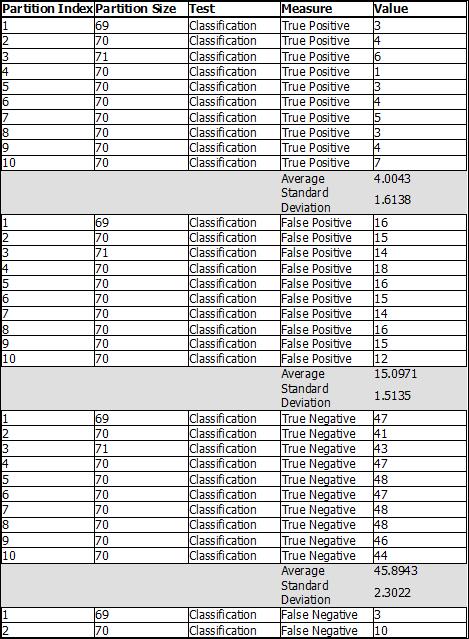
We have already had a look at the classification matrix in my previous article, but we can have a new look at it to better understand its values now that we have created the model here.
The cross validation tab will show the results of a sample of the data by separating them in a set of folds.
In my next article we'll explore in more depth these two last tabs: Mining accuracy chart and Mining model prediction to get a better understanding of what they show and help us get more information from the mining models we create.

