

As a new DBA, you will
probably walk into an environment that is poorly documented and nobody has any
idea of how many SQL Servers are on the network (To
find out this, see one of my FAQs). All developers are in the SYSADMIN role
on both the development server and production server. In addition, you'll need
to schmooze with the network people so they could give you access to the SQL
servers that you are supposed to administrator; You will need to monitor the
hard drive spaces on each server; You'll need to perform a benchmark analysis
for all the servers you're responsible for later tuning; You will need to create
maintenance plans for each server; You will need to practice emergency recovery;
You will also need to test and practice software upgrade, since about half of
your servers are in SQL 7.0; You will need to help the developers tune their
queries and convince them that they really should be using stored procedures,
etc. The list just goes on and on.
I recently started working
as a DBA in my company. I intend to write down and share with you my experience
as I try to put our SQL Servers in order. You might encounter similar issues in
your life as a DBA. Hopefully this will be helpful to you.
In the first series of my
articles, I'll talk about how to audit logins in your SQL Server.
What is SQL Trace
When a DBA comes into a new
environment, one of the first things needs to be done is to find out who is
using your database server, from which workstation or server, and which
application is using it. The best way to find this out is through SQL Trace.
In SQL Server 2000,
Microsoft has rewritten the server and client implementation of the tracing
functionality. In SQL 7.0, there are the xp_trace extended stored procedures to
create and execute traces and they are implemented with the Sqltrace.dll. In SQL
2000, this Sqltrace.dll mechanism was eliminated and replaced with sp_trace
stored procedures. In SQL 2000, SQL Trace generally is referred to as the
server-side implementation of the tracing mechanism, and SQL Profiler is the
client-side implementation. SQL Trace is more stable, and it's guaranteed that
all the events are captured, because it uses the server engine I/O API. Profiler
is the client-side implementation. It is not guaranteed to record all events,
especially in a high-stress environment.
To give you more details on
SQL Trace, it is integrated with the server engine. It's integrated with the UMS
scheduler and the server engine I/O itself. That means SQL Trace can't block
other processes from accessing critical resources, because the scheduler takes
care of it. When the SQL Trace generates trace files, it is a native server-side
file. In addition, there are new trace options based on time and size. When you
start the SQL Trace, you can set a predefined time at which you want to stop the
trace, or you can specify a predefined size where you can stop the trace.
Obviously, due to the
different design, information provided in this article does not apply to SQL 7
or SQL 6.5.
Trace logins and database access
When I started working on
one of my company's servers, I noticed that there are literally hundreds of
logins. Some are SQL logins while others are Windows authentication logins. Of
course, many of those are no longer being used. In addition, many of the Windows
authentication logins should really be put into a Global or Domain Local group
for easy administration.
To clean up all those
logins, I decided to do an audit on database access. I decided to audit not only
the login and logout events, but also the Add/Drop login event, Object GDR
event, among others. This way I could find out not only who is using which login
from which computer; I could also identify who is granting/removing/changing
logins.
The following script is
self-explanatory. This script will build a stored procedure that you can use to
audit database access and logins. It takes 2 parameters. The first one is the
directory path that you will use to store the trace file. The second parameter
is for duration. It determines how long the trace will last. Please note that I
commented in the scripts that you could easily change the trace to run in
seconds, minutes, days, or even weeks.
--Use the master database USE master go IF OBJECT_ID(‘dbo. usp_Login_Audit_Trace’) IS NOT NULL DROP PROCEDURE dbo.spRoleMembers GO CREATE proc usp_Login_Audit_Trace @path nvarchar(128), @duration smallint as /* Author: Haidong Ji Date: 11/08/2002 Purpose: Login audit. Try to track which logins and which databases are accessed Set up trace to a file in the path specified in the @path parameter (use UNC path for network drive) for the number of days/hours/minutes specified in the @duration input parameter. */ declare @tracestarttime datetime declare @traceident int declare @options int declare @filename nvarchar(245) declare @filesize bigint declare @tracestoptime datetime declare @createcode int declare @on bit declare @startcode int
set @tracestarttime = current_timestamp /* Set the name of the trace file. */ set @filename = cast(month(current_timestamp) as varchar) + '_' + cast(day(current_timestamp) as varchar) + '_' + cast(year(current_timestamp) as varchar) + '_' + cast(datepart(hh, current_timestamp) as varchar) + '_' + cast(datepart(mi, current_timestamp) as varchar) + '_' + cast(datepart(ss, current_timestamp) as varchar) set @options = 2 set @filename = @path + N'\' + @filename set @filesize = 20 /* You can change the first parameter in the dateadd function to set how long your trace will be For example, if it is hh, the trace will last @duration hours */ set @tracestoptime = dateadd(dd, @duration, @tracestarttime) set @on = 1 --set up the trace exec @createcode = sp_trace_create @traceid = @traceident output, @options = @options, @tracefile = @filename, @maxfilesize = @filesize, @stoptime = @tracestoptime if @createcode = 0 --trace created begin --set events and columns --Trace Login event exec sp_trace_setevent @traceident, 14, 1, @on exec sp_trace_setevent @traceident, 14, 6, @on exec sp_trace_setevent @traceident, 14, 7, @on exec sp_trace_setevent @traceident, 14, 8, @on exec sp_trace_setevent @traceident, 14, 9, @on exec sp_trace_setevent @traceident, 14, 10, @on exec sp_trace_setevent @traceident, 14, 11, @on exec sp_trace_setevent @traceident, 14, 12, @on exec sp_trace_setevent @traceident, 14, 14, @on exec sp_trace_setevent @traceident, 14, 18, @on exec sp_trace_setevent @traceident, 14, 34, @on exec sp_trace_setevent @traceident, 14, 35, @on
--Trace Logout event exec sp_trace_setevent @traceident, 15, 1, @on exec sp_trace_setevent @traceident, 15, 6, @on exec sp_trace_setevent @traceident, 15, 7, @on exec sp_trace_setevent @traceident, 15, 8, @on exec sp_trace_setevent @traceident, 15, 9, @on exec sp_trace_setevent @traceident, 15, 10, @on exec sp_trace_setevent @traceident, 15, 11, @on exec sp_trace_setevent @traceident, 15, 12, @on exec sp_trace_setevent @traceident, 15, 14, @on exec sp_trace_setevent @traceident, 15, 18, @on exec sp_trace_setevent @traceident, 15, 34, @on exec sp_trace_setevent @traceident, 15, 35, @on --Trace Audit Object GDR event exec sp_trace_setevent @traceident, 103, 1, @on exec sp_trace_setevent @traceident, 103, 6, @on exec sp_trace_setevent @traceident, 103, 7, @on exec sp_trace_setevent @traceident, 103, 8, @on exec sp_trace_setevent @traceident, 103, 9, @on exec sp_trace_setevent @traceident, 103, 10, @on exec sp_trace_setevent @traceident, 103, 11, @on exec sp_trace_setevent @traceident, 103, 12, @on exec sp_trace_setevent @traceident, 103, 14, @on exec sp_trace_setevent @traceident, 103, 18, @on exec sp_trace_setevent @traceident, 103, 34, @on exec sp_trace_setevent @traceident, 103, 35, @on --Trace Audit Add/Drop Login event exec sp_trace_setevent @traceident, 104, 1, @on exec sp_trace_setevent @traceident, 104, 6, @on exec sp_trace_setevent @traceident, 104, 7, @on exec sp_trace_setevent @traceident, 104, 8, @on exec sp_trace_setevent @traceident, 104, 9, @on exec sp_trace_setevent @traceident, 104, 10, @on exec sp_trace_setevent @traceident, 104, 11, @on exec sp_trace_setevent @traceident, 104, 12, @on exec sp_trace_setevent @traceident, 104, 14, @on exec sp_trace_setevent @traceident, 104, 18, @on exec sp_trace_setevent @traceident, 104, 34, @on exec sp_trace_setevent @traceident, 104, 35, @on --Trace Audit Login GDR event exec sp_trace_setevent @traceident, 105, 1, @on exec sp_trace_setevent @traceident, 105, 6, @on exec sp_trace_setevent @traceident, 105, 7, @on exec sp_trace_setevent @traceident, 105, 8, @on exec sp_trace_setevent @traceident, 105, 9, @on exec sp_trace_setevent @traceident, 105, 10, @on exec sp_trace_setevent @traceident, 105, 11, @on exec sp_trace_setevent @traceident, 105, 12, @on exec sp_trace_setevent @traceident, 105, 14, @on exec sp_trace_setevent @traceident, 105, 18, @on exec sp_trace_setevent @traceident, 105, 34, @on exec sp_trace_setevent @traceident, 105, 35, @on --Trace Audit Login Change Property event exec sp_trace_setevent @traceident, 106, 1, @on exec sp_trace_setevent @traceident, 106, 6, @on exec sp_trace_setevent @traceident, 106, 7, @on exec sp_trace_setevent @traceident, 106, 8, @on exec sp_trace_setevent @traceident, 106, 9, @on exec sp_trace_setevent @traceident, 106, 10, @on exec sp_trace_setevent @traceident, 106, 11, @on exec sp_trace_setevent @traceident, 106, 12, @on exec sp_trace_setevent @traceident, 106, 14, @on exec sp_trace_setevent @traceident, 106, 18, @on exec sp_trace_setevent @traceident, 106, 34, @on exec sp_trace_setevent @traceident, 106, 35, @on
--Trace Audit Add Login to Server Role event exec sp_trace_setevent @traceident, 108, 1, @on exec sp_trace_setevent @traceident, 108, 6, @on exec sp_trace_setevent @traceident, 108, 7, @on exec sp_trace_setevent @traceident, 108, 8, @on exec sp_trace_setevent @traceident, 108, 9, @on exec sp_trace_setevent @traceident, 108, 10, @on exec sp_trace_setevent @traceident, 108, 11, @on exec sp_trace_setevent @traceident, 108, 12, @on exec sp_trace_setevent @traceident, 108, 14, @on exec sp_trace_setevent @traceident, 108, 18, @on exec sp_trace_setevent @traceident, 108, 34, @on exec sp_trace_setevent @traceident, 108, 35, @on --Trace Audit Add DB User event exec sp_trace_setevent @traceident, 109, 1, @on exec sp_trace_setevent @traceident, 109, 6, @on exec sp_trace_setevent @traceident, 109, 7, @on exec sp_trace_setevent @traceident, 109, 8, @on exec sp_trace_setevent @traceident, 109, 9, @on exec sp_trace_setevent @traceident, 109, 10, @on exec sp_trace_setevent @traceident, 109, 11, @on exec sp_trace_setevent @traceident, 109, 12, @on exec sp_trace_setevent @traceident, 109, 14, @on exec sp_trace_setevent @traceident, 109, 18, @on exec sp_trace_setevent @traceident, 109, 34, @on exec sp_trace_setevent @traceident, 109, 35, @on --Trace Audit Add Member to DB event exec sp_trace_setevent @traceident, 110, 1, @on exec sp_trace_setevent @traceident, 110, 6, @on exec sp_trace_setevent @traceident, 110, 7, @on exec sp_trace_setevent @traceident, 110, 8, @on exec sp_trace_setevent @traceident, 110, 9, @on exec sp_trace_setevent @traceident, 110, 10, @on exec sp_trace_setevent @traceident, 110, 11, @on exec sp_trace_setevent @traceident, 110, 12, @on exec sp_trace_setevent @traceident, 110, 14, @on exec sp_trace_setevent @traceident, 110, 18, @on exec sp_trace_setevent @traceident, 110, 34, @on exec sp_trace_setevent @traceident, 110, 35, @on --Trace Audit Add/Drop Role event exec sp_trace_setevent @traceident, 111, 1, @on exec sp_trace_setevent @traceident, 111, 6, @on exec sp_trace_setevent @traceident, 111, 7, @on exec sp_trace_setevent @traceident, 111, 8, @on exec sp_trace_setevent @traceident, 111, 9, @on exec sp_trace_setevent @traceident, 111, 10, @on exec sp_trace_setevent @traceident, 111, 11, @on exec sp_trace_setevent @traceident, 111, 12, @on exec sp_trace_setevent @traceident, 111, 14, @on exec sp_trace_setevent @traceident, 111, 18, @on exec sp_trace_setevent @traceident, 111, 34, @on exec sp_trace_setevent @traceident, 111, 35, @on --filter Profiler exec sp_trace_setfilter @traceid = @traceident, @columid = 10, @logical_operator = 0, @comparison_operator = 7, @value = N'SQL Profiler' --start the trace exec @startcode = sp_trace_setstatus @traceid = @traceident, @status = 1 if @startcode = 0 begin select 'Trace started at ' + cast(@tracestarttime as varchar) + ' for ' + cast(@duration as varchar)+
' minutes; trace id is ' + cast(@traceident as nvarchar) + '.' end else begin goto Error end else begin goto Error return Error: select 'Error starting trace.' return GO
|
To find out
descriptions of Events and Columns, go to SQL Book On Line, click on Index tab,
and type sp_trace_setevent. This section of Book On Line will give you all the
necessary explanation of those event IDs and columns IDs. Three data columns are
worth mentioning here. The first one is the ClientHostname column. It tells you
the name of the client computer that originated the request. The second one is
the ApplicationName. It tells you the name of the client application that
created the connection to an instance of SQL Server. This column is populated
with the values passed by the application rather than the displayed name of the
program. The third one is NTUserName. It will give you the user Windows login
ID, if you are running a W2k network.
Scheduling the trace
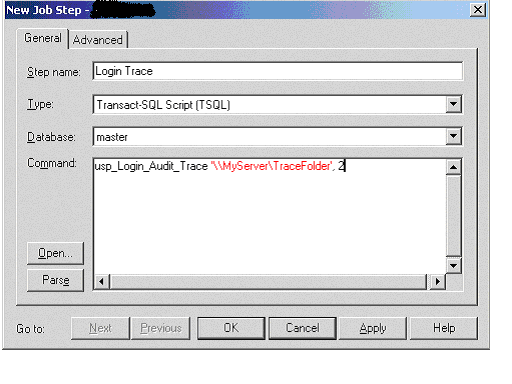
Once the stored procedure
is created, you can easily schedule it to run at the time you specify. To do
this, create a new SQL Server Agent job, create a new step for this job, and use
the stored procedure as the command. See the following picture. Finish the other
part of the job and the trace is ready to run as expected.
Before I ran the trace, I
was a little concerned if the trace would bring performance down on our
production server. I found out later that the overhead of this trace is minimal.
We didn’t notice any difference in performance when this trace was running.
Analyze the trace
After your trace stopped,
you could open the trace file using Profiler and view your results. When viewing
the results this way, Profiler really does not provide many means to sort or
filter your results. I found it easier to import the trace results into a SQL
table for easy analysis. To do this, you need to use one of the trace functions:
USE TraceDB
SELECT * INTO Trace_Table_Name FROM ::
fn_trace_gettable('c:\MyTrace.trc', default)
After running the above
T-SQL myself, I noticed that the trace file has to be on your local hard drive
in order for this to work. I tried to do this for a trace file on my network and
it failed every time. I tried both UNC and drive letters.
Another recommendation I
have is that you might want to create a separate database for your tracing
results, instead of using Northwind, Pubs or other user databases. Because it is
a security audit, you probably want to keep that information to yourself.
Summary
In this article, I shared
my experience of auditing logins and database access with you. Hopefully it will
be helpful to you. Columnist
Randy Dyess has some good articles on this subject as well.