

Getting the Most Out of SQL Server 2000's Query Analyzer, Part III
This is the third article in a series covering Query Analyzer, one of the
standard DBA tools which ship with SQL Server 2000. In this article we'll look
at how to customize our environment to maximize our use of this tool. Part I in
the series covered starting Query Analyzer and the methods of logging in to a
SQL Server. Part II covered an overview of the Object Browser, an addition from
the SQL Server 7 version. For the other articles in the series, visit the
following links:
- Getting
the Most Out of SQL Server 2000's Query Analyzer, Part I
- Getting
the Most Out of SQL Server 2000's Query Analyzer, Part II
Query Analyzer is like any solid other integrated development environment
(IDE), it is highly customizable by the individual user. Query Analyzer
"out of the box" is very useful and some people never worry about
modifying the configurations. However, I've found, like with any IDE in its
default configuration, there are some buttons that aren't on the toolbars, there
are some options I want that aren't turned on, and there are some colors and
editor settings which are not to my liking. By making changes to the
default configuration, I am able to be more efficient, more productive. This is
true of most developers. Slight tweaks can make a world of difference.
In this article we'll look at:
- Customizing the toolbar
- Editing shortcuts
- Adding custom tools
- Setting file options
- Configuring the editor
- Setting result output
- Defining connection settings
- Altering fonts and colors
- Selecting scripting options
Customizing the Toolbar
The toolbar contains our shortcut buttons. Like with any of the Microsoft
Office products such as Word or Excel, the toolbar is an essential part of our
Query Analyzer environment. The default toolbar is shown in Figure 1.
![]()
Figure 1: Default Toolbar
The default toolbar has most of what we need a mouse-click away.
Buttons for creating a new connection identical to an existing connection (same
server, same user account, same database) to opening or saving a file to the
standard copy/cut/paste options to change how we view the result set to what
database we're accessing are all configured initially. Here is the initial
configuration:
| Button | Function |
|---|---|
| New Query (Ctrl + N) | |
| Load SQL Script (Ctrl + Shift + P) | |
| Save Query/Result (Ctrl + S) | |
| Insert Template (Ctrl + Shift + Ins) | |
| Cut (Ctrl + X) | |
| Copy (Ctrl + C) | |
| Paste (Ctrl + V) | |
| Clear Window (Ctrl + Shift + Del) | |
| Find (Ctrl + F) | |
| Undo (Ctrl + Z) | |
Execute Mode
| |
| Parse Query (Ctrl + F5) | |
| Execute Query (F5) | |
| Cancel Query Execution (Alt + Break) | |
| Select Database | |
| Display Estimated Execution Plan (Ctrl + L) | |
| Object Browser (F8) | |
| Object Search (F4) | |
| Current Connection Properties | |
| Show Results Pane (Ctrl + R) |
There are a few more options available to us. One of these is
the ability to create a new connection. To have these options available to us on
the toolbar, we need to do some customization. In order to customize our
toolbar, we'll need to right-click on it (there aren't options for customizing
the toolbar from the various menus). This will bring up a new dialog window, as
shown in Figure 2.

Figure 2: Customize Toolbar Dialog Window
On the left side are the toolbar buttons which we have not added
to our toolbar. On the right side are the current toolbar buttons. If we select Connect
and click Add->, we'll add the button for establishing a new
connection to our toolbar.

Figure 3: Adding the Connect Button
When we click Close, our toolbar will be updated with our
new choice (Figure 4).
![]()
Figure 4: Connect Button on the Toolbar
Returning to Figure 3, if we want our toolbar back to the
default, we can simply click the Reset button. We also have the ability
to arrange the order of our buttons by using the Move Up and Move Down
buttons. The button at the top will be on the far left. Buttons will be placed
to the right of the first button in the order they appear in the list.
Since the toolbar is one of the most used pieces to Query
Analyzer, it makes sense to customize it. One of the first things I always do is
ensure the Connect button is added. I usually need connections open to
multiple servers at one time and find the button on the toolbar to be a
timesaver. I also tend to add the Print and T-SQL Help buttons as
well. Adding these buttons to the toolbar helps me be more efficient. Experiment
and find what works for you.
Editing Shortcuts
From the Tools menu we can select the Customize option (Figure
5).

Figure 5: Customize Option from Tools Menu
Selecting Customize brings up a new dialog window which shows the Custom
tab, as in Figure 6. This tab is where we can define shortcuts for use in Query
Analyzer. Query Analyzer already has the system stored procedures sp_help,
sp_lock, and sp_who assigned to shortcut keys.

Figure 6: Custom Tab
I tend to use sp_who2 as opposed to sp_who when I want to check
database activity. It's an undocumented but rather well-known system stored
procedure which returns the same information as sp_who and more. Query
Analyzer straight out-of-the-box doesn't have a shortcut for sp_who2 so
I'll need to make one. A good option for my shortcut is Ctrl + 0, which
is isolated from the other shortcuts. In order to use Ctrl + 0 as
my shortcut for sp_who2, I'll just need to type in sp_who2 in the
stored procedure space, as in Figure 7.

Figure 7: Added sp_who2 as a Shortcut
Once my shortcut has been defined, I can hit Ctrl + 0 and Query
Analyzer will automatically execute sp_who2 and return the information in
the results pane (Figure 8).

Figure 8: Shortcut Used to Execute sp_who2
If you aren't familiar with sp_who2, it returns the same
information as sp_who with a few additional columns. The main reason I
use it is because it includes the program name. For more information on sp_who2,
visit the following link: http://www.microsoft.com/TechNet/prodtechnol/sql/maintain/optimize/inside14.asp.
This link is where Microsoft has made available Chapter 14 from Inside SQL
Server 7.0.
Adding Custom Tools
Query Analyzer doesn't have built-in hooks to the other SQL Server utilities
like both Enterprise Manager and SQL Profiler do. For instance, Figure 9 shows
the Tools menu from Enterprise Manager where we see both Profiler and Query
Analyzer.

Figure 9: Enterprise Manager Tools Menu
If we look at either Figure 6 or 7, we'll see another tab beside Custom
called Tools. We can add other applications to our Tools menu by
configuring them using the Tools tab. A pristine Query Analyzer has no
tools configured (Figure 10).

Figure 10: Tools Tab
Since SQL Profiler is a very useful tool, let's add it to our Tools list. The
first step is to click on the Add button (shown in Figure 10). We'll have
a chance to give our tool a name, which for this example is SQL Profiler (Figure
11).

Figure 11: Naming the Tool (SQL Profiler)
Once we hit Enter, the Command, Arguments, and Initial
Directory become available. If we click on the ellipses button ![]()
Query Analyzer will bring up the common dialog box for choosing files. We can
navigate to the default location for SQL Profiler (C:\Program Files\Microsoft
SQL Server\80\Tools\Binn\profiler.exe) as shown in Figure 12.

Figure 12: Locating profiler.exe
Once we've located SQL Profiler, the next step is to give it the appropriate
command line arguments. Two key arguments are:
| Switch | Purpose |
|---|---|
| /S<Server Name> | Points Profiler to the proper server |
| /E | Tells Profiler to use Integrated Security |
By using these two command line arguments, we can have Profiler connect to
the server we're connected to through Query Analyzer using Integrated (NT
Authentication) Security. The one catch is substituting <Server Name>.
If we click on the arrow button ![]()
beside Arguments we'll get a menu of options, among them Server. Using it, we
can define a set of arguments like: /S$(Server) /E (Figure 13).

Figure 13: Profiler Added with Arguments
Once we click OK, SQL Profiler will now appear in the Tools menu (Figure 14).

Figure 14: SQL Profiler in Tools Menu
We can repeat the same steps to add Enterprise Manager, the Client Network
Utility, our favorite text editor, or whatever else we desire.
Setting File Options
If we choose Options from the Tools menu instead of Customize,
we bring up a dialog box (Figure 15). The initial tab displayed is the General
tab and that is where we can set our file options.

Figure 15: General Tab
If we have a particular directory where our query files should be located, we
can have Query Analyzer start there by default. I typically have a Source
directory which differs from my normal My Documents directory. So one change I
can make is to set Query file directory to C:\Source\SQL to always have
Query Analyzer start in that directory when I want to retrieve queries or save
them. I also can store my results separately, and the directory I'll set for it
is C:\Source\SQL\Results.
There are a couple of other setting changes I like to make. First, I usually
select for Query Analyzer to be the default editor for query extensions (in this
case the default *.sql). I also check the box so when I close out Query
Analyzer, I'm not prompted on whether or not to save my work. A good 90% of the
time when I bring up Query Analyzer, I'm running queries against a production
system to check its health. I don't need to be prompted to save my EXEC
sp_who2 command when I'm exiting.
With the configuration changes I've made, the General tab will typically look
as it does in Figure 16
.
Figure 16: Modified General Tab
Let's look at one final feature on the General tab. There are two
buttons labeled Load... and Save... which allow us to preserve our
configuration settings. If we go through the trouble of setting up the options
for Query Analyzer to our liking on one system, we don't want to have to repeat
this for every new client configuration. Thankfully, we can save a file with our
configuration settings and then use this file on a different client. When we
click the Save... button, we are prompted to save our settings to a *.sqc
file. All we have to do is make this file accessible by another client and use
the Load... button. This configuration file will record the settings for
all of the tabs on the Options dialog box, so if we make changes to our
color scheme under the Fonts tab., those changes will preserved as well.
Configuring the Editor
Beside the General tab we find the Editor tab. Intuitively, I
would think this tab is where we set colors, but it is not. Instead, it sets
options such as how many Undo buffers to keep, how large the overall Undo buffer
is, how many spaces constitute a tab, whether or not to convert tabs to spaces,
and the like, as shown in Figure 17.
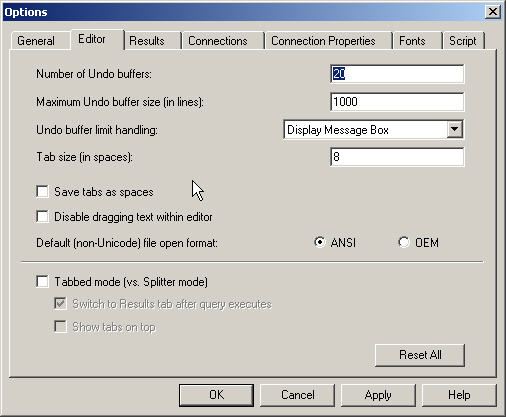
Figure 17: Editor Tab
Most of the settings on this tab are fine for me. About the only one I change
is the Tab size. I prefer a tab size of either 2 or 4, but certainly not 8.
Making this small change leaves us with Figure 18.

Figure 18: Tab Size Modified
Now my tabs will result in much more compact code since Query Analyzer is
only going to indent two spaces as opposed to eight. This works well for me.
Another option that sometimes works for me is disabling dragging. If I am
working from a laptop with a touchpad as opposed to a system with a mouse, a
single slip of my finger can result in text being highlighted and dragged some
place I didn't intend. If the touchpad seems a bit too sensitive for me, I'll
disable text dragging.
Setting Result Output
One of the differences I noticed about Query Analyzer in SQL Server 2000 is
it produced result sets in Grid mode by default. I had gotten so used to typing Ctrl
+ D to switch to Grid mode it took me a few days to notice this change from
the default of Text mode in SQL Server 7's Query Analyzer. However, if we prefer
Text, we can set the default output under the Results tab (Figure 19).

Figure 19: Results Tab
One other nice feature is the ability to have a sound played when a query
batch is completed. While in the course of the normal business day this isn't a
necessity as we run quick queries for monitoring. However, if we have to kick
off a long running query, we're going to go on to do something else. A sound cue
alerting us that the query has finished is nice. We then can switch back.
Perhaps for annoyance sake I've got a .wav file with a cow mooing for my system
I work on at home. My wife glares any time it plays, then rolls her eyes, and
then sighs, but I've not had the heart to turn it off. I like the cow mooing.
Even for those short running queries.
Defining Connection Settings
There are a few ways to access a dialog box containing the connection
settings. The first way is from the Query menu (Figure 20):

Figure 20: Connection Properties from the Query Menu
This brings up a dialog box with the various options for connection
properties. Another way is the Current Connections Properties button on
the toolbar. These two methods are focused solely on the connection, so there is
only one tab (Figure 21), unlike what we've seen under Options.

Figure 21: Current Connection Properties Dialog Window
The SET options we could execute normally are all gathered together for us.
If we're worried about performance, we have to be careful what SET options we
choose, because we can cause unnecessary stored procedure recompiles. There are
quite a few articles on this problem, and most come from the following Microsoft
Knowledge Base Article:
has begun a series of articles which discuss the ANSI options in more detail.
Here is the first article:
The other way we can get to connection settings is through Options, as
we've already been exploring. There is a Connection Properties tab where
our settings are kept each time we open up Query Analyzer. The other two methods
modify Current Connection Properties and these settings are discarded
when we close Query Analyzer. If we want to preserve our settings, we have to go
through Tools | Options and then select the Connection Properties
tab (Figure 22).

Figure 22: Connection Properties Tab
If we take a quick glance at figures 21 and 22, we'll see the tabs are
identical. The only difference is if we go through Options we keep our
settings. If we use the other two methods, the settings return back to the
configuration in Options the next time we open up Query Analyzer.
Altering Fonts and Colors
I typically use the standard colors and fonts that are set by default in
Query Analyzer. However, some developers prefer to customize the appearance of
the editor. We can change the appearance using the Fonts tab. Figure 23
shows the default configuration.

Figure 23: Fonts Tab with Default Configuration
A developer friend of mine configures whatever he's using as an IDE to the
basic color scheme that came with Microsoft QuickBasic 4. We can make Query
Analyzer's editor look the same by making modifications to the configuration.
I've altered the configuration, as shown in Figure 24, to look more like the old
QuickBasic color scheme.

Figure 24: Modified Settings on Fonts Tab
If we look at the editor in Query Analyzer after the changes are made, we're
greeted with a familiar environment for those of who were former QuickBasic
coders (Figure 25).

Figure 25: QuickBasic 4 Color Scheme
A good color scheme and font selection is important for prolonged development
effort. We have the capability to modify Query Analyzer's editor to match our
preferences. Combining this with the ability to save our preferences and load
them, we can customize our environments quickly and easily.
Selecting Scripting Options
The final customization choice we'll look at is defining scripting options.
The object browser is a powerful tool. One of the functions we have at our
disposal with the addition of the object browser is the ability to quickly
script individual objects. Like scripting in Enterprise Manager, there are many
options to choose from, and the Script tab in Figure 26 shows them.

Figure 26: Script Tab
We can choose into include descriptive headers, have the script drop the
object if it exists, not include collation, include permissions, and a whole
host of other choices. There are a few choices I make because of my work
environment. Most of the databases I support do not make use of filegroups
because they are relatively small and would benefit little from segregating
tables on different filegroups or even tables and indexes. When a best value
analysis is done, the cost requirements in additional hardware are not justified
by the minimal performance gain. As a result, I'll toggle off the Do not
include 'ON <filegroup>' clause directing filegroup use. With the few
databases in my environment that require such an option, it's more efficient to
toggle them specifically. The second change I make is not to script collation
clauses because they should be set at the database level for any of our SQL
Server 2000 installations. These changes are shown in Figure 27.

Figure 27: Modified Scripting Options
If I choose to script a table, these changes will be taken into account. If I
need to make sure my scripts are compatible with SQL Server 7.0 (as we have them
in the inventory still) I can toggle that setting on as well.
Concluding Remarks
We've looked at the customization options available to us in SQL Server
2000's Query Analyzer. Query Analyzer is an important tool; we should make it
work for us. If we don't like the colors and fonts, we can change them. If we
have certain connection requirements or need to add certain tools so we can call
them from within QA, we have the ability to do so. We also have the ability to
customize the toolbar, adding and removing buttons to suit our needs. The great
thing about our customizations is we can save them and apply them everywhere our
client tools are installed.
