RVO - Wednesday, February 22, 2017 9:30 AM
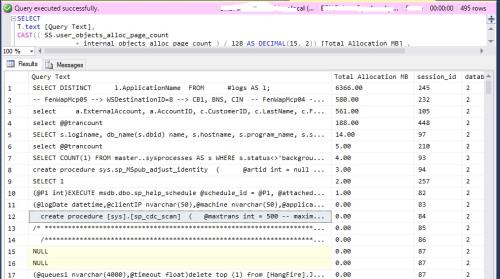
Not a bad place to start... especially on that first one. See that "SELECT DISTINCT"? That's normally a pretty good indication that someone thought "set based" meant "all in one query" and ended up with an accidental "many-to-many" join that caused a large number of duplicates to be formed behind the scenes.
In the absence of other tools, if you open the "Object Explorer" in SSMS (reminder, press the {f8} key to get there if it's not already open), right click on the instance at the top of the window, select reports and continue to drill down to the "performance" related reports, find the two concerning IO and CPU. Those will show you the top 10 consumers of IO and CPU. The most hungry use of resources isn't always the longest running code. Sometimes it's fairly short running code that is executed 10's of thousands of times per hour. Don't forget that the values on those reports are cumulative since the last time cache was cleared or since the last time the server was rebooted. If you want to reset it without rebooting, pick a quiet time during the day and execute a DBCC FREEPROCCACHE on the box. The first people to use queries will see some slowness because all queries will need to recompile. Before you do that, though, see the next paragraph below.
There's also "hidden" code that costs a whole lot to run. That's usually code that creates one execution plan per run and won't show up on the reports I just told you about. I've recently run into such a problem myself. I had previously identified the code as a possible future performance issue. No one believed me especially since the code "only" took 100 ms per run to execute (which is actually ridiculously long considering how short the code is and how many times per hour it's executed, IMHO). What no one else realized was that not only would the code recompile every time it was executed, it would take 2 -17 seconds to compile every time. I proved it with the code from the following article.
https://www.sqlskills.com/blogs/jonathan/identifying-high-compile-time-statements-from-the-plan-cache/
So, there are actually 4 areas to study... TempDB hogs, Long running code, code that runs frequently, and repetitive code that recompiles every time it's used. If you can fix just the top 1 or 2 from each of those categories, you'll be amazed at how well the server starts to work. Don't stop, though. Get through at least the top 5 of each category and then be ever vigilant. Developers can write a ton of performance challenged code in a hurry because most of it won't be long code.
--Jeff Moden
RBAR is pronounced "ree-bar" and is a "Modenism" for Row-By-Agonizing-Row.
First step towards the paradigm shift of writing Set Based code:
________Stop thinking about what you want to do to a ROW... think, instead, of what you want to do to a COLUMN.
Change is inevitable... Change for the better is not.
Helpful Links:
How to post code problems
How to Post Performance Problems
Create a Tally Function (fnTally)